
Managing Stock Market Risk In A Schizophrenic Environment
Stocks Reverse Two-Day Slide
Stocks tried to regain their short-term mojo Wednesday following some better than expected economic data and a development on the regulatory front. From Bloomberg:
Data today showed new-home sales in the U.S. surged in August to the highest level in more than six years, a sign that the housing recovery is making progress…Eight of the 10 main S&P 500 groups gained as health-care companies jumped 1.6 percent, after a two-day slide, amid signs the Obama administration’s efforts to curtail tax-friendly overseas deals might fall short.
How Much Damage To Equities?
While the top callers continue to get attention, the reality is stocks dropped for two days following last week’s new highs. The market continues to be concerned about a future shift from the Fed, which aligns well with the historical interest rate cycle script. A Fed-induced correction could occur in the coming months. Is there a way to monitor risk in the equity markets?
Trends Speak To Economic Conviction
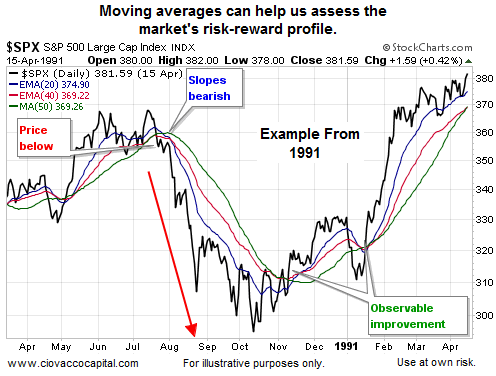
Trends can help with risk management. When the net aggregate opinion of all market participants is favorable, markets tend to push higher. Conversely, when the net aggregate opinion becomes pessimistic, markets tend to drop. Moving averages help us monitor the market’s pulse. During a correction, the S&P 500 (shown in black below) tends to drop below the colored moving averages. Also note the slopes of the colored moving averages MAS tend to roll over during sharper pullbacks in equity prices. Relative to the bearish period on the left, the bullish period on the right side of the chart looks quite a bit different (price above MAs, slopes of MAs are positive).
How Does The Market Look Today?
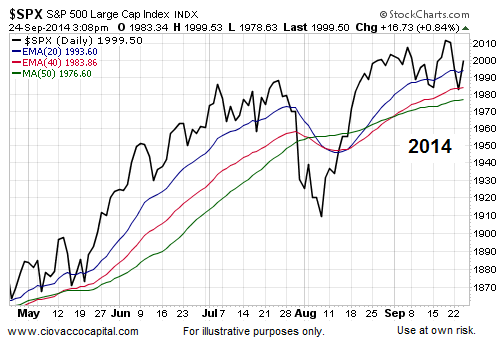
The chart below is as of 3:08 p.m. ET Wednesday. While there are reasons to be concerned and to pay closer attention, the market has not rolled over in a significant manner. The chart below tells us to exercise some patience with the core portion of our equity-based holdings.
Investment Implications - The Weight of The Evidence
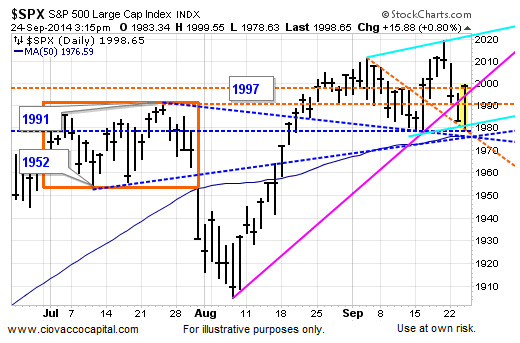
It is not all fun and games from a risk-reward perspective. Wednesday morning the S&P 500 hit a low of 1,978 and was testing the important cluster of support shown below. The market held, but the issues related to a flat 50-day moving average, outlined on September 16, still apply.
Fed: Mixed Message On Rates
On Tuesday, Federal Reserve Bank of St. Louis President James Bullard said he sees the Fed raising interest rates some time early next year. On Wednesday, Chicago Federal Reserve Bank President Charles Evans took the other side of the argument saying the Fed should be “exceptionally patient” in removing monetary policy accommodation.
Guideposts Can Help
How can we logically balance risk and reward in this schizophrenic environment? One way is to use market levels as a guide. The tweet during Tuesday’s selloff in stocks illustrates the concepts.
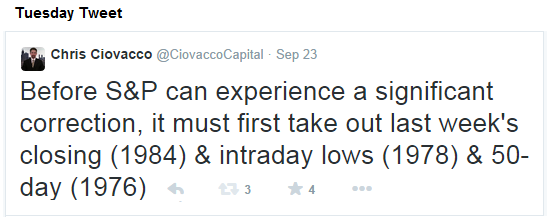
The S&P 500 closed below 1984 Tuesday, but above the more important 1976 (50-day moving average). Therefore, we reduced risk in a relatively small manner before Tuesday’s close. When stocks rallied Wednesday, we still had significant equity exposure. Why do we use a level-based and incremental approach?
As long as the S&P 500 holds above the key support cluster in the 1976 area, our bias will be to leave our stocks VOO and leading sectors XLK alone. Below 1976, we will be more apt to make some additional chess moves. The market will guide us if we are willing to listen.
Disclosure: None.


