
Long And Short Of Short Interest - Wednesday, Sept. 26
Here is a brief review of period-over-period change in short interest in the September 4-14 period in nine S&P 500 sectors.
XLB (SPDR materials ETF)
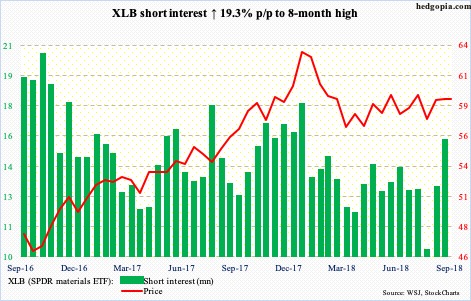
XLB (59.40) short interest is at an eight-month high. On September 20, the ETF was rejected at resistance at 61-plus, and has since come under pressure. Tuesday, the 200-day moving average (59.44) was ever so slightly breached. The 50-day (59.15) is right underneath. On the daily chart, there is room for XLB to continue lower.
XLE (SPDR energy ETF)
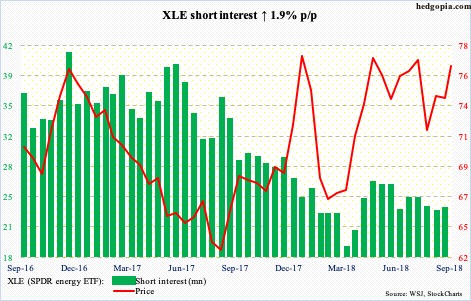
Tuesday, XLE (76.69) broke out of a falling trend line from May 22 but also produced a doji right outside the daily upper Bollinger band. Back then, it peaked at 79.42. Bulls would love to test 77.60, but conditions are getting overbought near term. It began to rally from an intraday low of 71.78 on September 7. Digestion of these gains – either through time or price – is only natural.
XLF (SPDR financial ETF)
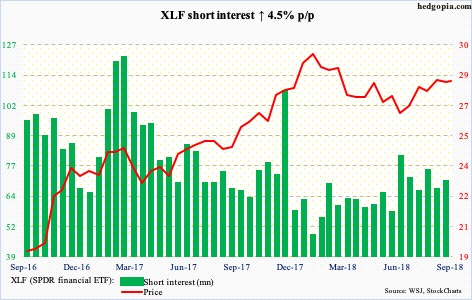
XLF (28.31) bulls managed to take out 28.50 on September 19 but only fleetingly. One day later, it peaked at 29.07 in a spinning top session. Several weekly momentum indicators are turning lower. The 50- and 200-day (28.20 and 28.10, respectively) lie just below. At least a test of these averages looks imminent.
XLI (SPDR industrial ETF)
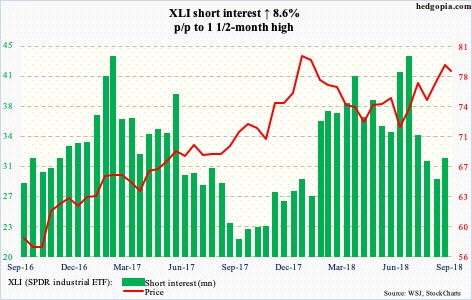
Bulls just got denied at important resistance. XLI (78.39) peaked late January at 80.96. Last Thursday, it began retreating after hitting 80.41. There are decent odds it continues lower. Tuesday, a rising trend line from late June was breached – albeit slightly. There is decent support at just under 77. The 50-day (76.75) rests right there.
XLK (SPDR technology ETF)
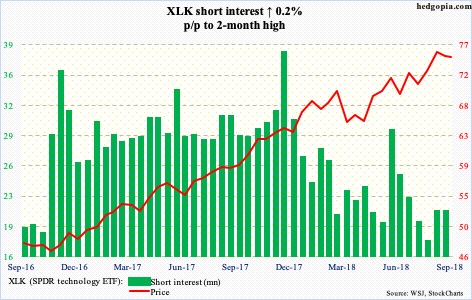
XLK (74.89) bulls have done a good job of defending both the 50-day and a rising trend line from February/April. That said, the ETF has been unable to lift off of it. It has essentially traded right above the 50-day since September 6. Odds favor a breach at some point. Relatively speaking, short interest remains low. The build-up post-presidential election in November 2016 is all but gone.
XLP (SPDR consumer staples ETF)
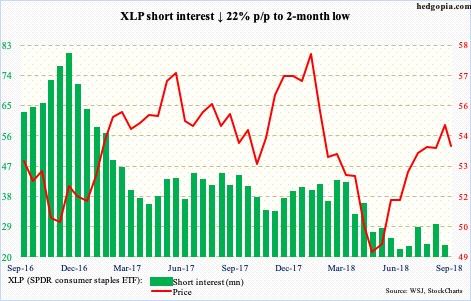
From early May through mid-August, XLP (53.86) has had quite a rally, when it retreated after hitting 55.31. Resistance at 55-55.50 goes back two-plus years. This level was tested again – unsuccessfully – last Thursday when the ETF rallied to 55.33. The 50-day (53.95) has been lost. A test of the 200-day takes place at 53.41.
XLU (SPDR utilities ETF)
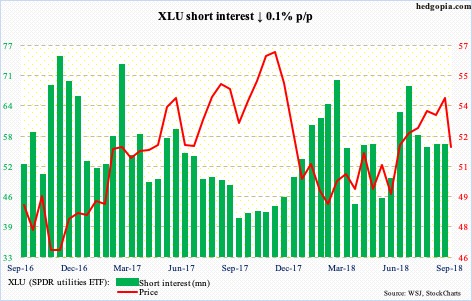
Resistance at just under 55 proved too tough to crack. After hammering on it for a whole month beginning mid-August, bulls gave up. XLU (51.87) began to genuinely come under pressure last Wednesday. The recent rise in the 10-year Treasury yield did not help. There is decent support at just under 51. The 200-day is at 51.32.
XLV (SPDR healthcare ETF)
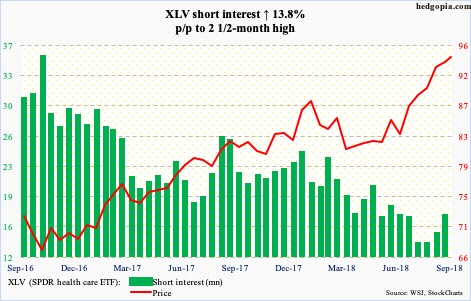
XLV (94.17) shorts added a little in the past month. But bulls continue to carry the momentum. A month ago, the ETF broke out of 91.80, followed by successful breakout retest. Near term, the daily chart seems to want to go lower. To get any traction, bears need a breach of 93 first.
XLY (SPDR consumer discretionary ETF)
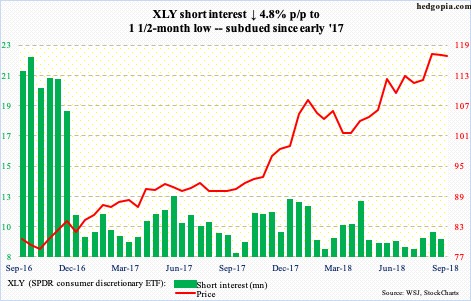
With three sessions to go, September thus far has produced a doji. This comes after five consecutive positive months. On the weekly chart too, there are some signs of distribution in recent weeks, having more or less gone sideways in the past month. Last Friday, XLY (116.65) rallied to a new intraday high of 118.08. Nearest support lies at 115.
Disclaimer: This article is not intended to be, nor shall it be construed as, investment advice. Neither the information nor any opinion expressed here constitutes an offer to buy or sell any ...
more

