
Key Charts For Fed Day
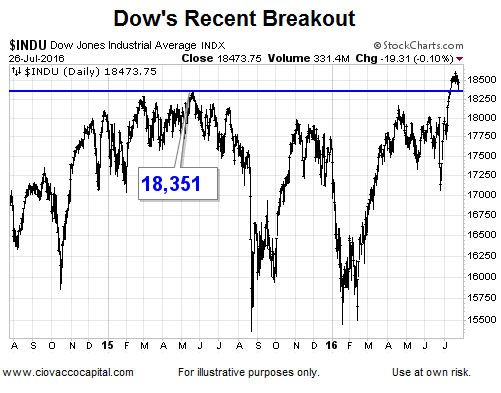
The 1994 case demonstrates the longer stocks go sideways, the bigger the move we can expect after a successful breakout. However, even under the successful breakout scenario, a retest of prior resistance may be in the cards, which is exactly what happened in early 1995. In 2016, the Dow Jones Industrial Average (below) may be in retest mode.
Reflation Trade
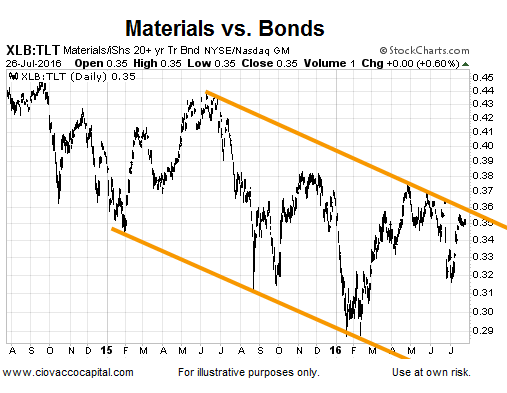
Given the high levels of global debt, the lesser of the evils alternative typically is to try to inflate it away. The chart below, showing the performance of materials stocks (XLB) relative to Treasuries (TLT), is one way to monitor the battle between inflation and lingering concerns about deflation.
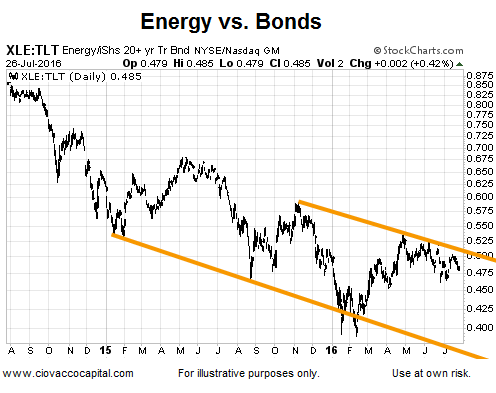
Like the XLB/TLT ratio above, the ratio of energy stocks (XLE) to Treasuries (TLT) also has some work to do. With a Fed statement coming Wednesday and one from the Bank of Japan before the end of the week, these ratios should provide some insight into the market’s reaction.
Stocks vs. Bonds
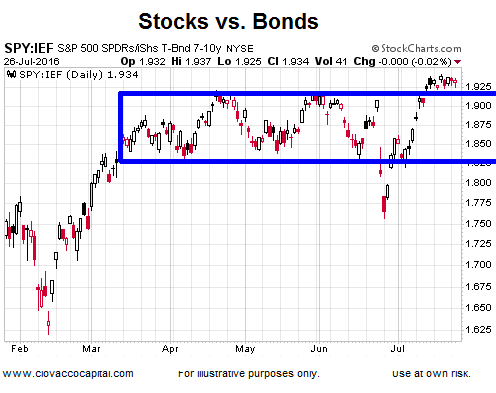
The S&P 500 (SPY) has not yet broken out relative to long-term Treasuries, but has made some progress relative to intermediate-term Treasuries (IEF). If the SPY/IEF breakout below holds, it will improve the odds of the S&P 500’s recent push above 2,134 holding.
Disclosure: This post contains the current opinions of the author but not necessarily those of Ciovacco Capital Management. The opinions are subject to change ...
more

