
June 2015 New Home Sales Rate Of Growth Softens, And Below Expectations
Written by John Lounsbury and Steven Hansen
The headlines say new home sales declined from last month. The rolling averages smooth out much of the uneven data produced in this series - and this month there was an improvement in the rolling averages.The data was revised downward in the previous months making the bad headlines even worse than first glance.

As the data is noisy, the 3 month rolling average is the way to look at this data. This data series is suffering from methodology issues. Econintersect analysis:
- unadjusted sales growth accelerated 6.8 % month-over-month (after last month's revised deceleration of 16.6%).
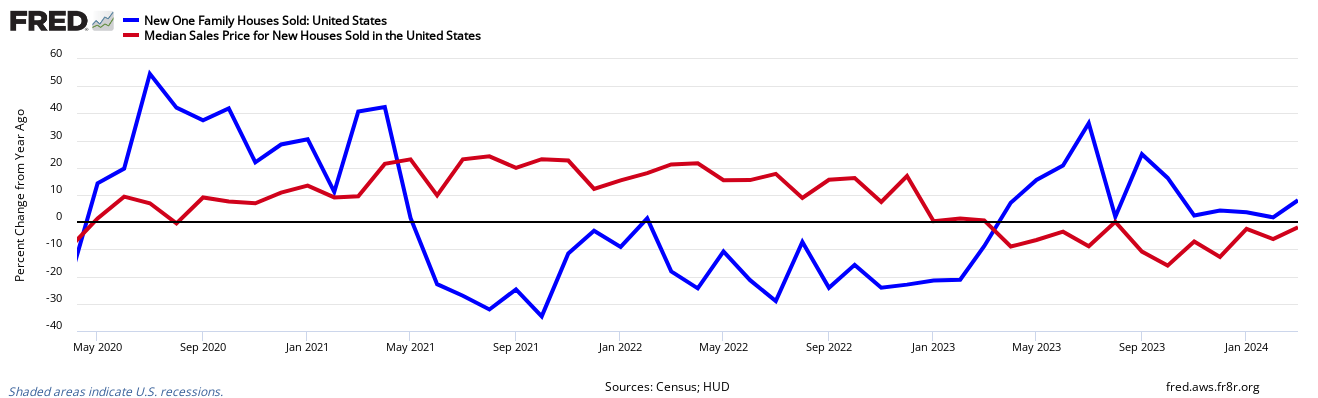
- unadjusted year-over-year sales up 18.4% (Last month was up 11.6%). Growth this month is on the high end of the range of growth seen last 12 months.
- three month unadjusted trend rate of growth accelerated 0.2% month-over-month - is up 19.2% year-over-year.
Unadjusted Year-over-Year Rate of Growth - Sales (blue line) and 3 month rolling average of Sales (red line)

- seasonally adjusted sales down 6.8% month-over-month
- seasonally adjusted year-over-year sales up 18.1%
- market expected (from Bloomberg) seasonally adjusted annualized sales of 535K to 570K (consensus 550K) versus the actual at 482.
The quantity of new single family homes for sale remains well below historical levels.
Seasonally Adjusted New Homes for Sale

As the sales data is noisy (large monthly variations).
Year-over-Year Change - Unadjusted New Home Sales Volumes (blue line) with zero growth line emphasized
The headlines of the data release:
Sales of new single-family houses in June 2015 were at a seasonally adjusted annual rate of 482,000, according to estimates released jointly today by the U.S. Census Bureau and the Department of Housing and Urban Development. This is 6.8 percent (±12.5%)* below the revised May rate of 517,000, but is 18.1 percent (±18.1%) above the June 2014 estimate of 408,000. The seasonally adjusted estimate of new houses for sale at the end of June was 215,000.
Unadjusted New Home Sales Monthly Volumes In Thousands

The median sales price of new houses sold in June 2015 was $281,800; the average sales price was $328,700.
Unadjusted Median New Home Sales Price

This represents a supply of 5.4 months at the current sales rate.
Seasonally Adjusted - Number of Months of Supply of New Homes at Current Rate of Sales

Caveats on Use of New Home Sales Data
This data is compiled by sampling, and historically has little revision. This data is based on contracts signed - not actual properties conveyed.
To provide nationwide coverage of building activity, a multi-stage stratified random sample procedure was used to select approximately 900 building permit-issuing offices, and a sample of more than 70 land areas not covered by building permits.
Each month, for permit-issuing places, a sample of residential building permits is selected from each of the sampled permit offices. The probability of selecting a permit is proportional to the number of units authorized by the permit. Permits for one-to-four-unit buildings are sampled at an overall rate of 1 in 50. All permits authorizing buildings with 5 or more housing units in the sampled permit offices are selected.
Each month, for areas that do not require building permits, field representatives conduct a road canvass in each of the sampled non-permit land areas to identify the start of new buildings. All new residential buildings found are selected for the survey.
Once a permit or building is selected, a field representative contacts the owner or builder, by telephone or in person, to conduct the interview each month as necessary. Contact continues until the project is either completed or abandoned. If a single-family home is not sold by the time of completion, the project will continue to be followed until the sale occurs. Each month, interviews are required for about half of the buildings currently being followed up.
Each month, housing starts, completions, and sales estimates derived from this survey are adjusted by the total numbers of authorized housing units (obtained from the Building Permits Survey) to develop national and regional estimates. Estimates are adjusted to reflect variations by region and type of construction, and to account for late reports and houses started or sold before a permit has been issued. Reported data are seasonally adjusted. The Construction Methodology (PDF) document contains further information.
As in most US Census reports, Econintersect does not agree with the seasonal adjustment methodology used and provides an alternate analysis. The issue is that the exceptionally large recession and subsequent economic roller coaster has caused data distortions that become exaggerated when the seasonal adjustment methodology uses several years of data. Further, Econintersect believes there may be a New Normal seasonality and using data prior to the end of the recession for seasonal analysis could provide the wrong conclusion.
Econintersect determines the month-over-month change by subtracting the current month's year-over-year change from the previous month's year-over-year change. This is the best of the bad options available to determine month-over-month trends - as the preferred methodology would be to use multi-year data (but the New Normal effects and the Great Recession distort historical data).
With new home sales at 25% of past rates, whatever your interpretation of the new home sales data is not significant enough to matter. Also the data is distorted by the first home buyer's stimulus which required contract signing before 30 April 2010 - causing a data bubble and subsequent trough. In spite of Econintersect's reservations about the efficacy of seasonal adjustment at the present time, it is interesting to look at the deep history of the seasonally adjusted data.
The broad bottoming process for new home sales in 2010 may not be confirmed or denied for another year or more. The critical factor will be whether the one-year positive trend can continue as year-over-year comparisons will no longer be against the very low sales after the collapse of the tax credit stimulus micro-bubble.
The seasonally adjusted new home sales rate is the lowest it has been for 50 years and has been at that level for almost two years. At the beginning of 1963 the U.S. population was around 188 million. With annual new home sales averaging around 550,000 per year in 1963, the extreme depression in the new home market is evident. In 1963 the rate of new home sales was about 290,000 per 100 million of population. In 2011 the number is about 100,000 per 100 million.
It is more informative to look at these changes over the nearly fifty-year history. The following graph shows new home sales normalized to population from from St, Louis Fed:
Seasonally Adjusted New Home Sales Ratio to Population

The same data is plotted below to include the average for the entire period and two moving averages (graph updated through October 2011):

The bottom line is that the new home market is in an extreme depression and the apparent bottoming process has been dragging on for two years, if in fact the bottom has been reached. Recent review of the Fed 2011 stress tests for banks has a new recession scenario that would see home prices decline another 20% from here. It is unlikely that the attempts to complete a bottom here could hold under those conditions. Econintersect analysis of recession indicators is still not seeing the start of new U.S. recession, however. We can only hope that outlook continues.
Disclosure: None.


