
Is Bank Of New York Mellon Corp A Buy At Its Current P/E Multiple?
Bank of New York Mellon Corp (NYSE: BK) trades at a P/E multiple of 13.0x, which is lower than the Financials sector median of 18.7x. While this makes BK appear like a stock to add to your portfolio, you might change your mind after gaining a better understanding of the assumptions behind the P/E ratio. In this article, I will break down what the P/E ratio is, how to interpret it and what to watch out for.
Understanding Valuation Multiples and the P/E Ratio
A Multiples Valuation, also known as a Comparable Companies Analysis, determines the value of a subject company by benchmarking the subject's financial performance against similar public companies (Peer Group). We can infer if a company is undervalued or overvalued relative to its peers by comparing metrics like growth, profit margin, and valuation multiples.
A P/E Multiple is a valuation ratio that indicates the multiple of earnings investors are willing to pay for one share of a company:
P/E Multiple = Stock Price ÷ Earnings Per Share
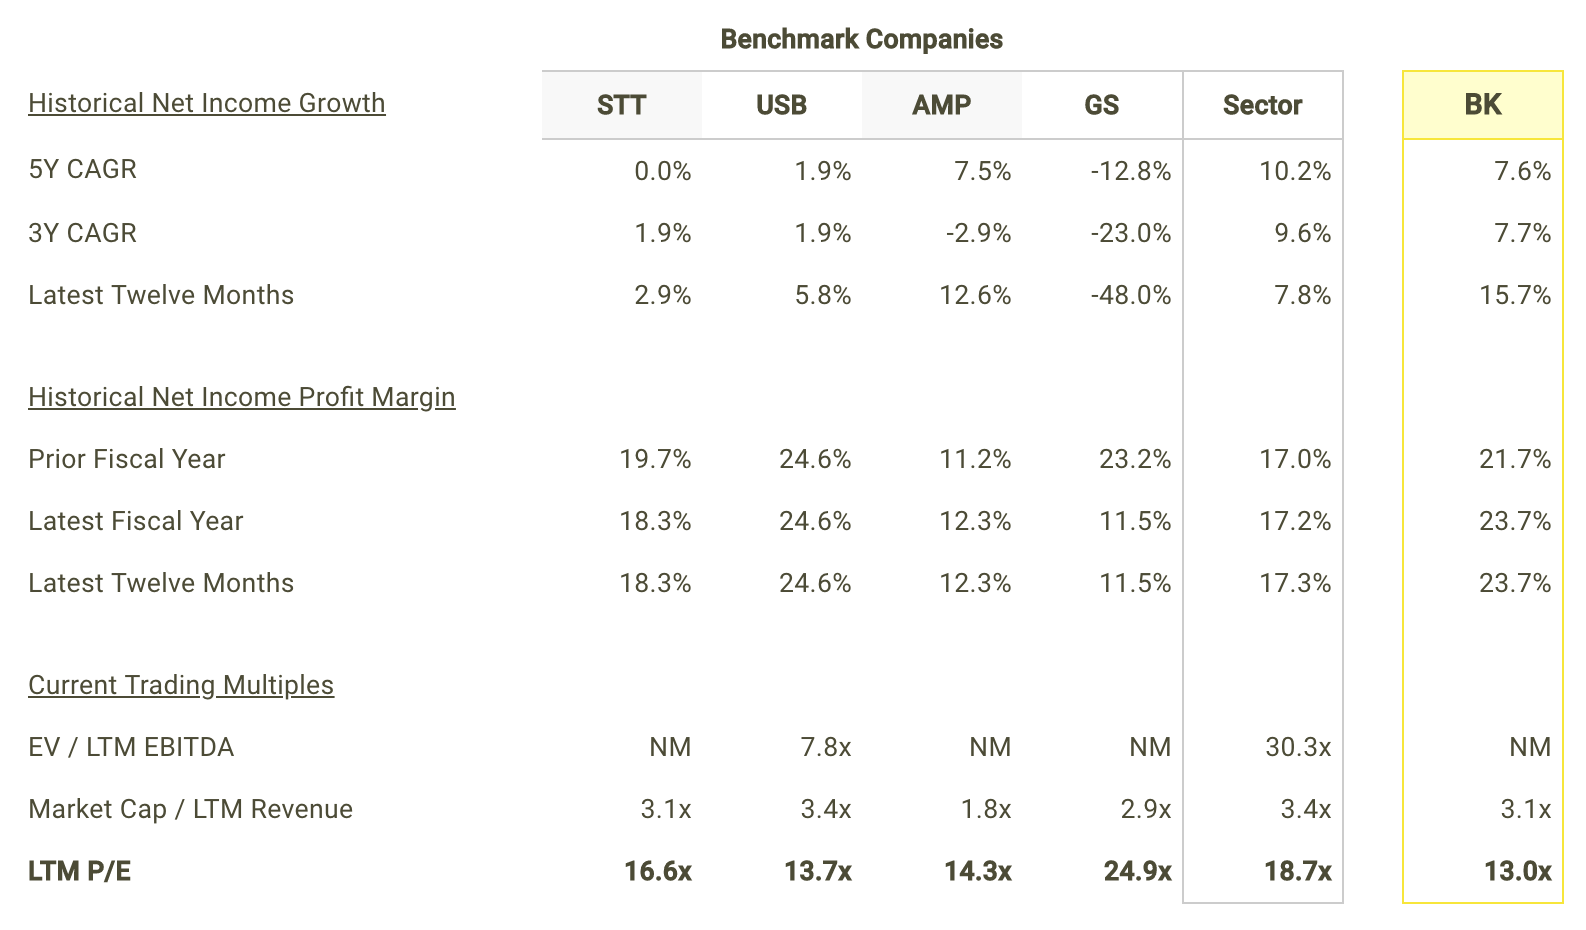
The P/E ratio is not meant to be viewed in isolation and is only useful when comparing it to other similar companies. Since it is expected that similar companies have similar P/E ratios, we can come to some conclusions about the stock if the ratios are different. I compare Bank of New York's P/E multiple to those of State Street Corporation (NYSE: STT), U.S. Bancorp (NYSE: USB), Ameriprise Financial, Inc. (NYSE: AMP) and Goldman Sachs Group, Inc. (The) (NYSE: GS) in the chart below.
(Click on image to enlarge)

source: finbox.io Benchmarks: P/E Multiples
Since Bank of New York's P/E of 13.0x is lower than the median of its peers (15.5x), it means that investors are paying less than they should for each dollar of BK's earnings. As such, our analysis shows that BK represents an undervalued stock. In fact, finbox.io's P/E Multiple Model calculates a fair value of $61.36 per share which implies 17.7% upside.
(Click on image to enlarge)
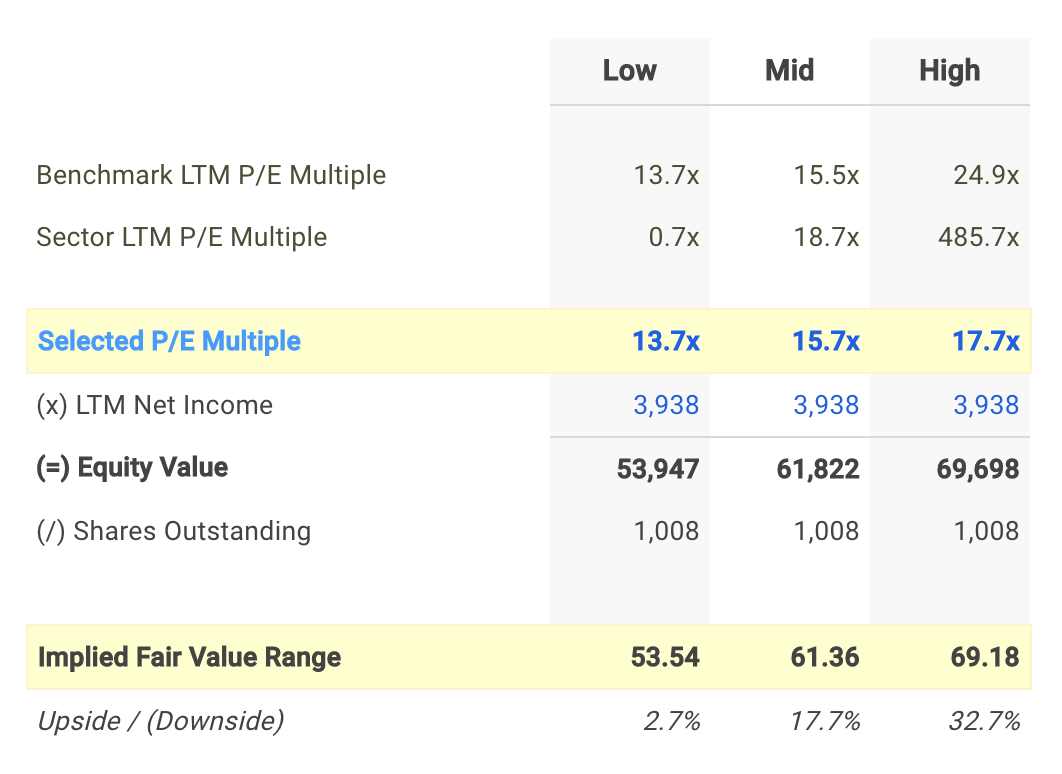
Note that the selected multiple of 15.7x in the analysis above was determined by averaging Bank of New York's current P/E multiple with its peer group and sector.
Understanding the P/E Ratio's Limitations
Before jumping to the conclusion that Bank of New York should be added to your portfolio, it is important to understand that our conclusion rests on two important assumptions.
(1) the selected peer group actually contains companies that truly are similar to Bank of New York, and
(2) the selected peer group stocks are being fairly valued by the market.
If the first assumption is not accurate, the difference in P/E ratios could be due to a variety of factors. For example, if you accidentally compare Bank of New York with higher growth companies, then its P/E multiple would naturally be lower than its peers since investors reward high growth stocks with a higher price.
(Click on image to enlarge)
source: P/E model
Now if the second assumption does not hold true, Bank of New York's lower multiple may be because firms in our peer group are being overvalued by the market.
Disclaimer: As of this writing, I did not hold a position in any of the aforementioned securities and this is not a buy or sell recommendation on any security mentioned. I also have no ...
more

