
Indicator Review: The Table Appears To Be Set For…
Good Monday morning and welcome back to the land of blinking screens. North Korea’s obsession with missiles, the issues of Tax Reform and the Debt Ceiling, and what I call “Fed Expectations” are in focus this week. On the latter, note that, according to Bloomberg, the futures-implied odds of another rate hike in 2017 currently stand at just 40% as many folks contend that the FOMC is more interested in beginning a “balance sheet normalization” plan than hiking rates again soon. However, with both PIMCO and BlackRock publicly talking about inflation hitting the Fed’s 2% target in the near-term after Friday’s better-than expected jobs report, we should probably be on the lookout for the “reflation trade” to make a comeback. Thus, traders will be paying particular attention to every word uttered as Fed officials return to the speaking circuit this week.
But since it’s the start of a new week, let’s focus on our objective review the key market models and indicators and see where things stand. To review, the primary goal of this weekly exercise is to remove any subjective notions one might have in an effort to stay in line with what “is” happening in the markets. So, let’s get started.
The State of the Trend
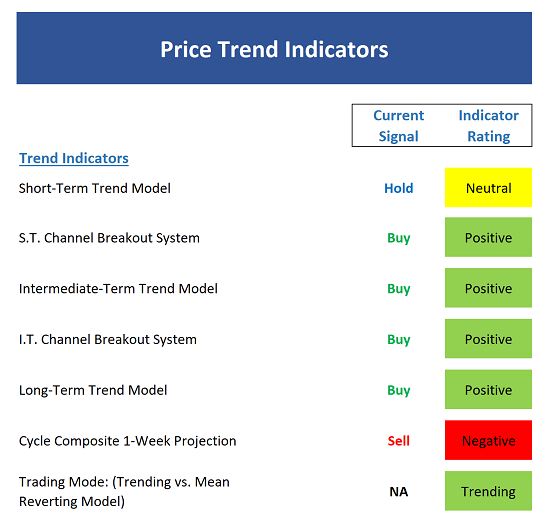
We start each week with a look at the “state of the trend.” These indicators are designed to give us a feel for the overall health of the current short- and intermediate-term trend models.
Executive Summary:
- With the SPX moving sideways for the past three weeks, it isn’t surprising to see some weakness creep into the short-term Trend Model
- Both the short- and intermediate-term Channel Breakout Systems remain on buy signal. The short-term system would flash a sell signal below 2459 and the intermediate-term system below 2405
- The intermediate-term Trend Model remains positive.
- The long-term Trend Model is also solidly positive.
- The Cycle Composite has turned negative and will stay there for some time.
- The Trading Mode models continue to suggest the market is in a trending environment.
The State of Internal Momentum
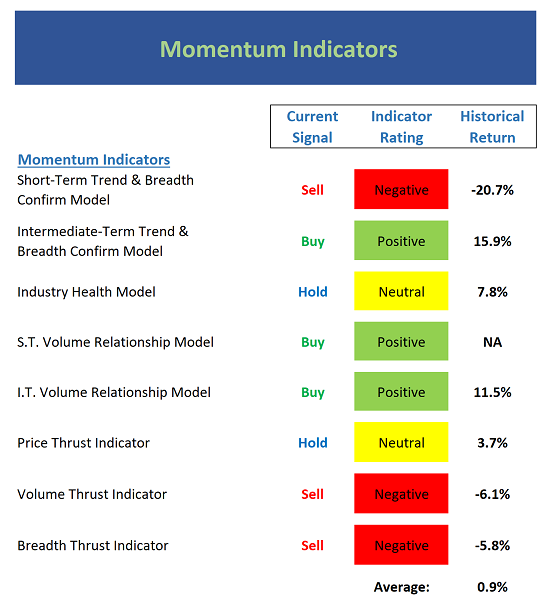
Next up are the momentum indicators, which are designed to tell us whether there is any “oomph” behind the current trend…
Executive Summary:
- The short-term Trend and Breadth Confirm Model slipped to negative last week – albeit by a slim margin.
- Our intermediate-term Trend and Breadth Confirm Model remains positive.
- After poking its head up into the positive zone for a brief period, the Industry Health Model is back to neutral this week.
- The short-term Volume Relationship is technically positive, but the up-volume line continues to trend down.
- The intermediate-term Volume Relationship model remains positive. However, the demand volume line is flirting with the low end of a trading range and very close to the lowest point of the year. Any further weakness could cause the line to enter a downtrend.
- The Price Thrust Indicator fell back to neutral as the recent momentum was not sustained.
- The Volume Thrust Indicator is no negative.
- The Breadth Thrust Indicator is also negative.
- In sum, short-term momentum has faltered.
The State of the “Trade”
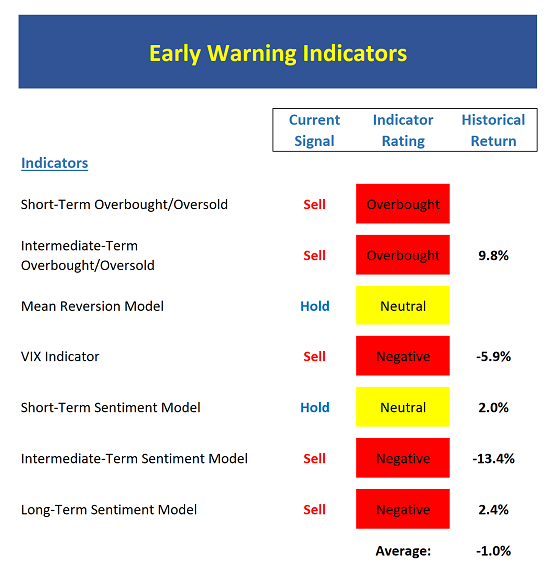
We also focus each week on the “early warning” board, which is designed to indicate when traders may start to “go the other way” — for a trade.
Executive Summary:
- From a near-term perspective, stocks remain overbought.
- Stocks remain overbought also from an intermediate-term view.
- The Mean Reversion Model is stuck in neutral.
- The VIX Indicators remain on sell signals.
- From a short-term perspective, market sentiment is now at the low end of neutral.
- The intermediate-term Sentiment Model remains very negative.
- Longer-term Sentiment readings haven’t budged and the model suggests extreme complacency in the market.
The State of the Macro Picture
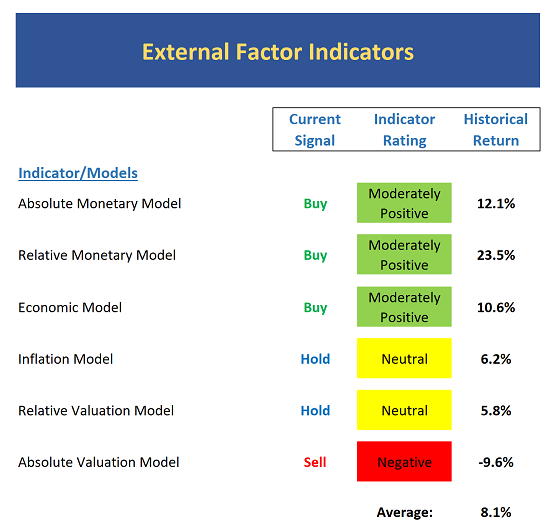
Now let’s move on to the market’s “external factors” – the indicators designed to tell us the state of the big-picture market drivers including monetary conditions, the economy, inflation, and valuations.
Executive Summary:
- The Absolute Monetary model remains at the low end of the positive range.
- On a relative basis, our Monetary Model suggests conditions have improved to moderately positive
- Our Economic Model (designed to call the stock market) hasn’t moved and is currently moderately positive.
- The Inflation Model continues to fall in the neutral zone. This suggests inflation pressures are trending down.
- Our Relative Valuation Model is neutral but edging back toward undervalued (note the correlation of this to the improvement in the monetary models)
- The Absolute Valuation Model remains VERY negative.
The State of the Big-Picture Market Models
Finally, let’s review our favorite big-picture market models, which are designed to tell us which team is in control of the prevailing major trend.
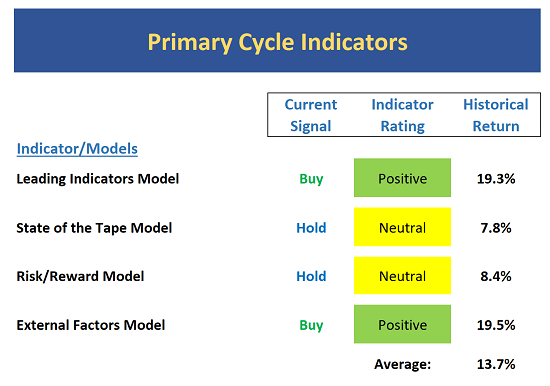
Executive Summary:
- The Leading Indicators model, which was briefly neutral a while back, is now solidly positive.
- The Tape continues to struggle and is back to neutral. The fact that the indices are near all-time highs and this model is neutral really says it all – leadership is narrow.
- After briefly turning positive, the Risk/Reward model slipped back to neutral last week.
- The External Factors model remains ever-so slightly positive.
The Takeaway…
Let’s see… the trend and momentum models have weakened, the market remains overbought, sentiment is overly positive, and the historical cycles suggest a meaningful decline could begin any day now. However, the bigger-picture/external factors models remain constructive and suggest above-average gains. As such, one could argue that stocks are “set up” for a corrective phase. Thus, if the bears can find a negative “trigger” they could be in business for a while. But given the macro backdrop, buying the dips still makes sense here.
Publishing Note: My wife and I are closing on and moving into our new home this week. As such, I will publish reports only if time and energy level permits.
Thought For The Day:
The four most dangerous words in investing are: This time it’s different. -Sir John Templeton
Current Market Drivers
We strive to identify the driving forces behind the market action on a daily basis. The thinking is that if we can both identify and understand why stocks are doing what they are doing on a short-term basis; we are not likely to be surprised/blind-sided by a big move. Listed below are what we believe to be the driving forces of the current market (Listed in order of importance).
1. The State of the U.S. Economic Growth (Fast enough to justify valuations?)
2. The State of Earnings Growth
3. The State of Trump Administration Policies
4. The State of the Fed
Disclosure: At the time of publication, Mr. Moenning and/or Sowell Management Services held long positions in the following securities mentioned: none. Note that positions may change at any ...
more

