How Increasing Interest Rates Affect Equity Returns
Since last September, the yield on the U.S. 10-Year Treasury has steadily increased from 2.05%, eventually surpassing the important psychological level of 3%.1 While we’ve written recently about the implications of rising rates for fixed income investors, we believe it is important to understand the consequences this has for equity investors too.
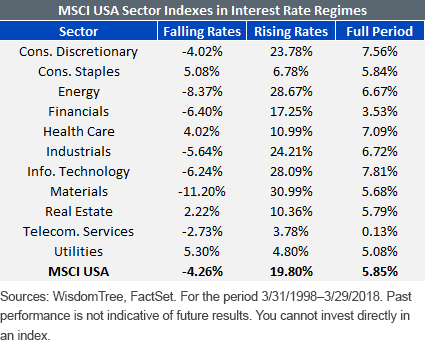
Rising interest rate periods are often associated with a more positive view on economic growth. As a result, cyclical sectors—such as Consumer Discretionary, Industrials and Financials—tend to outperform during periods of rising interest rates. Similarly, falling interest rates are associated with a slowdown in economic growth. Defensive sectors—such as Consumer Staples, Utilities and Health Care—fare better when rates are falling.
Defining rising and falling interest rate periods by looking at trends in the moving averages for the U.S. 10-Year Treasury yield2 allows us to see how sectors typically behave during the different regimes. The table below shows how different sectors within the MSCI USA Index performed over the past 20 years. We can see that equities in general performed better when rates were rising. We can also see that defensive sectors outperformed during falling rate periods, while cyclicals outperformed when interest rates rose.

More than 11 years ago, WisdomTree pioneered fundamentally weighted indexes by launching its U.S. dividend- and earnings-weighted Index families. Once a year, WisdomTree’s U.S. dividend-weighted Indexes will weight dividend payers by their aggregate share of indicated dividends to be paid. Likewise, the U.S. earnings-weighted Indexes are reconstituted annually, weighting companies with positive earnings by their proportionate share of total aggregate earnings. Companies with greater earnings generally have larger weights in the Index. Both dividend- and earnings-weighted families have a total market version along with large-, mid- and small-cap size cuts.
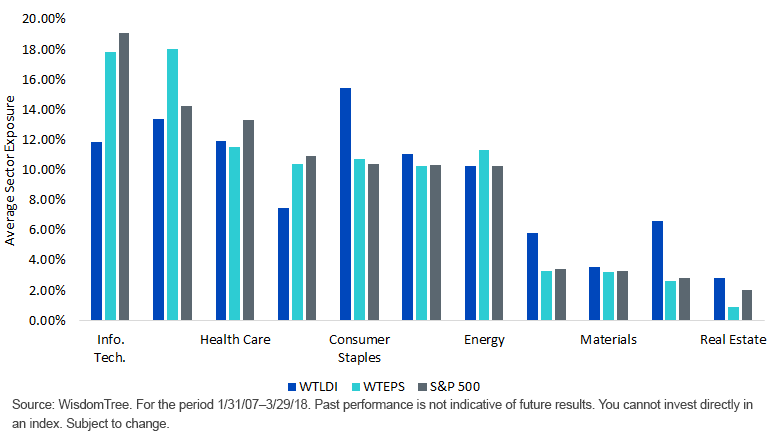
By construction, fundamentally weighted indexes show specific characteristics that deviate from traditional market cap-weighting benchmarks. For example, the WisdomTree U.S. LargeCap Dividend Index (WTLDI) has a higher aggregate dividend yield than the S&P 500 Index and has been over-weight in defensive sectors. The WisdomTree U.S. Earnings 500 Index (WTEPS) has a lower price/earnings ratio than the S&P 500 Index and has had a higher exposure to cyclical sectors. The chart below shows the difference in average sector exposures over the past 11 years.
Average Sector Exposure

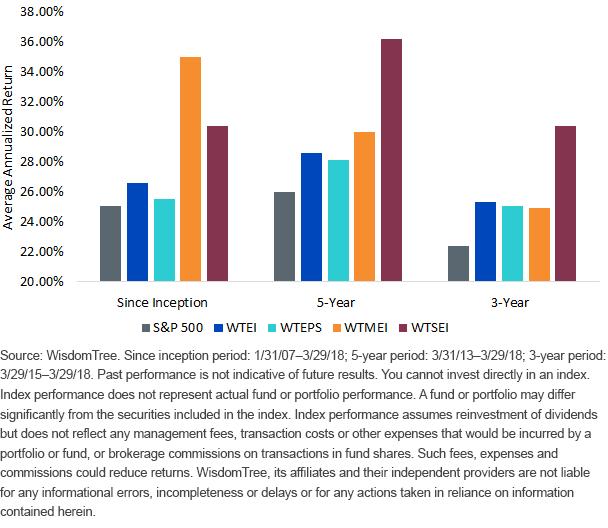
These characteristics can help explain performance during different macroeconomic regimes. Below, we focus on how WisdomTree’s U.S. earnings family—consisting of the WisdomTree U.S. Total Earnings Index (WTEI), the WisdomTree Earnings 500 Index (WTEPS), the WisdomTree MidCap Earnings Index (WTMEI) and the WisdomTree SmallCap Earnings Index (WTSEI)—has performed when interest rates rise across different time periods.
WisdomTree U.S. Earnings Family: Returns When Interest Rates Rise

Additional Index information available here.
Looking at the chart above, we can see that all members of WisdomTree’s U.S. earnings family have performed better than the S&P 500 Index when interest rates rise, regardless of the time period. It is also worth noting that the MidCap and SmallCap Earnings Indexes have had a higher outperformance.
The last time the market experienced a rise in interest rates comparable to what we’ve seen so far this year was in 2013, when the yield on the U.S. 10-Year Treasury increased 117 basis points (bps) from April through December. During this period, WisdomTree’s MidCap and SmallCap Earnings Indexes outperformed the S&P 500 Index, which rose 20.21%, by 378 and 954 bps, respectively. If interest rates continue to trend higher, exposure to the WisdomTree MidCap Earnings Fund (EZM) and the WisdomTree SmallCap Earnings Fund (EES), which track WTMEI and WTSEI, respectively, could be a good addition to the equity portion of your portfolio.
1Source: Bloomberg. Data as of 5/8/18.
2We are defining rising and falling interest rate months using trends in the 50-day simple moving average for USGG10YR and confirming the classification looking at trends in the 50-day and 100-day centered moving averages.
Disclaimer: Investors should carefully consider the investment objectives, risks, charges and expenses of the Funds before investing. U.S. investors only: To obtain a prospectus containing this ...
more


