
Home Prices Rose 5.0% Year-over-Year, Slow Gains In July
Written by Jill Mislinski
With today's release of the July S&P/Case-Shiller Home Price we learned that seasonally adjusted home prices for the benchmark 20-city index were unchanged month over month The seasonally adjusted year-over-year change has hovered between 4.4% and 5.4% for the last twelve months.With today's release of the July S&P/Case-Shiller Home Price we learned that seasonally adjusted home prices for the benchmark 20-city index were unchanged month over month The seasonally adjusted year-over-year change has hovered between 4.4% and 5.4% for the last twelve months.
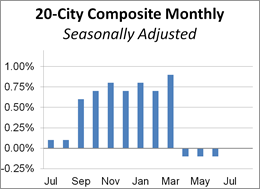
The adjacent column chart illustrates the month-over-month change in the seasonally adjusted 20-city index, which tends to be the most closely watched of the Case-Shiller series. It was unchanged from the previous month. The nonseasonally adjusted index was up 5.0% year-over-year.
Investing.com had forecast a -0.1% MoM seasonally adjusted decrease and 5.1% YoY nonseasonally adjusted for the 20-city series.
Here is an excerpt of the analysis from today's Standard & Poor's press release.
"Both the housing sector and the economy continue to expand with home prices continuing to rise at about a 5% annual rate,” says David M. Blitzer, Managing Director and Chairman of the Index Committee at S&P Dow Jones Indices. “The statement issued last week by the Fed after its policy meeting confirms the central bank’s view that the economy will see further gains. Most analysts now expect the Fed to raise interest rates in December. After such Fed action, mortgage rates would still be at historically low levels and would not be a major negative for house prices,
"The S&P CoreLogic Case-Shiller National Index is within 0.6% of the record high set in July 2006. Seven of the 20 cities have already set new record highs. The 10-year, 20-year, and National indices have been rising at about 5% per year over the last 24 months. Eight of the cities are seeing prices up 6% or more in the last year. Given that the overall inflation is a bit below 2%, the pace is probably not sustainable over the long term. The run-up to the financial crisis was marked with both rising home prices and rapid growth in mortgage debt. Currently, outstanding mortgage debt on one-to-four family homes is 12.6% below the peak seen in the first quarter of 2008 and up less than 2% in the last four quarters. There is no reason to fear that another massive collapse is around the corner." [Link to source]
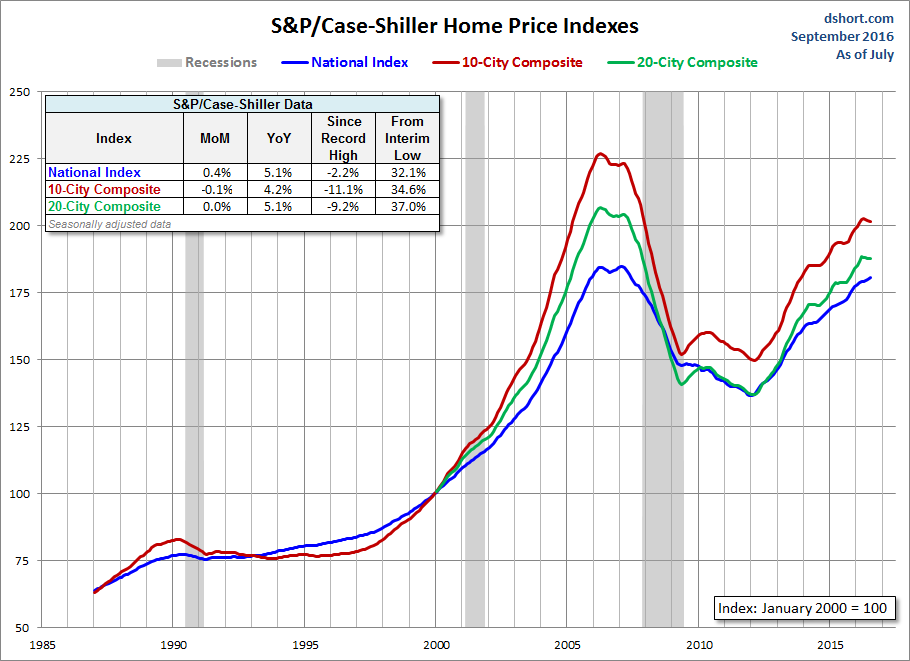
The chart below is an overlay of the Case-Shiller 10- and 20-City Composite Indexes along with the national index since 1987, the first year that the 10-City Composite was tracked. Note that the 20-City, which is probably the most closely watched of the three, dates from 2000. We've used the seasonally adjusted data for this illustration.
(Click on image to enlarge)
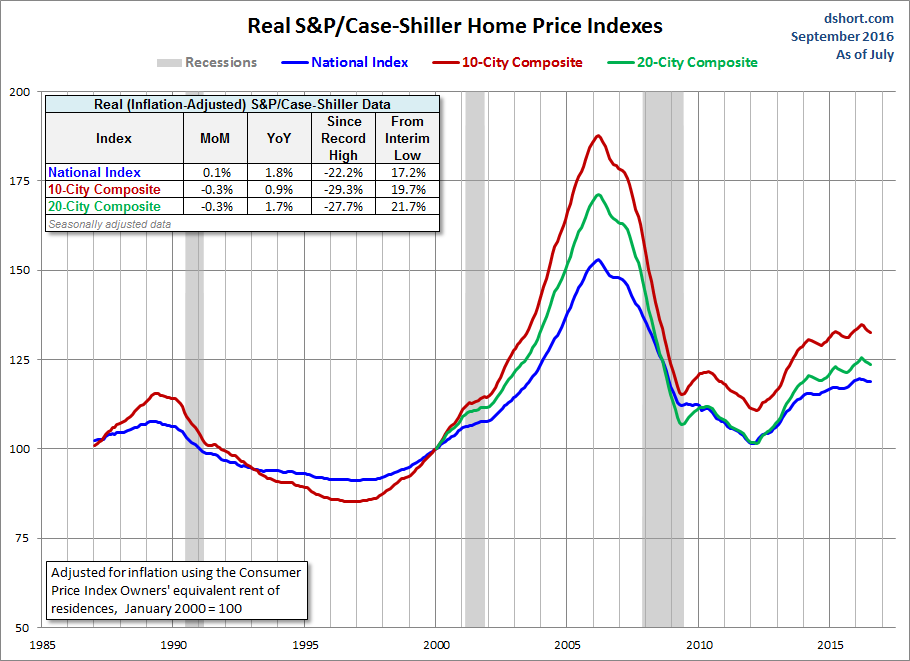
For an understanding of the home price data over longer time frames, we think a real, inflation-adjusted visualization of the data is an absolute necessity. Here is the same chart as the one above adjusted for inflation using a subcomponent of Bureau of Labor Statistics' Consumer Price Index, the owners' equivalent rent of residences, as the deflator. Among other things, the real version gives a better sense of the dynamics of the real estate bubble that preceded the last recession.
(Click on image to enlarge)
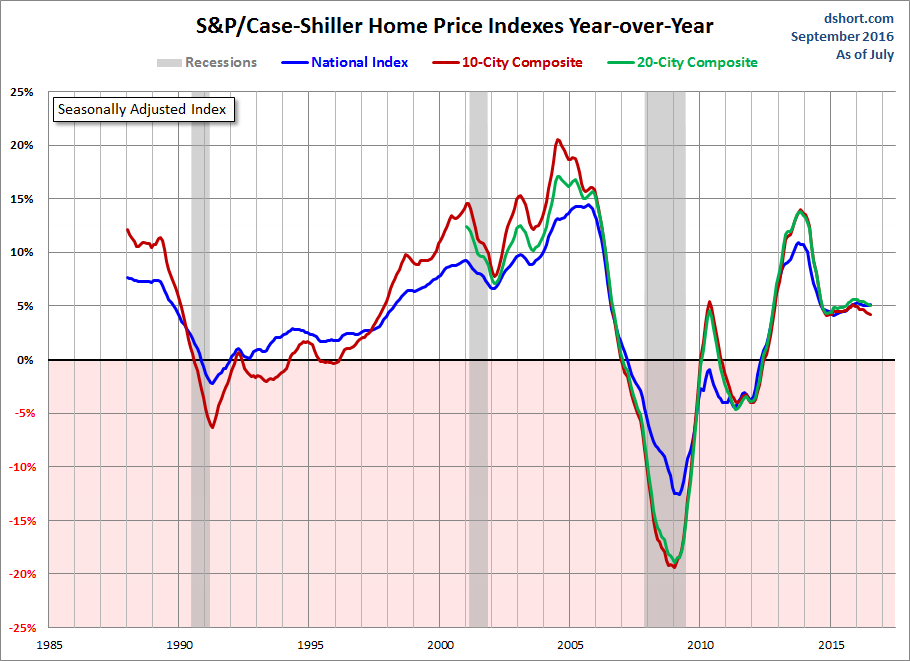
The next chart shows the year-over-year Case-Shiller series, again using the seasonally adjusted data.
(Click on image to enlarge)
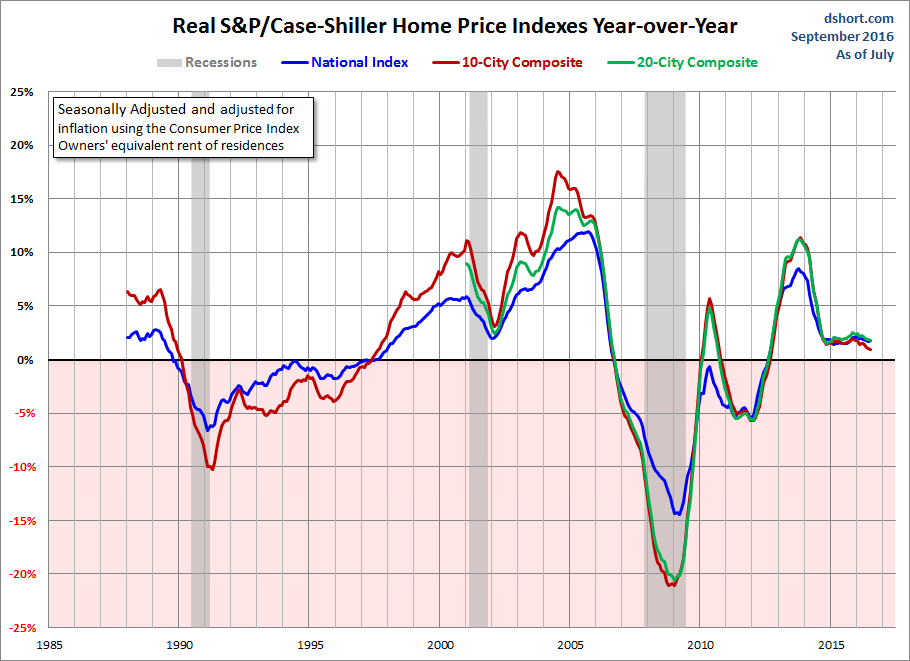
Here is the same year-over-year overlay adjusted for inflation with the Consumer Price Index owners' equivalent rent of residences.
(Click on image to enlarge)
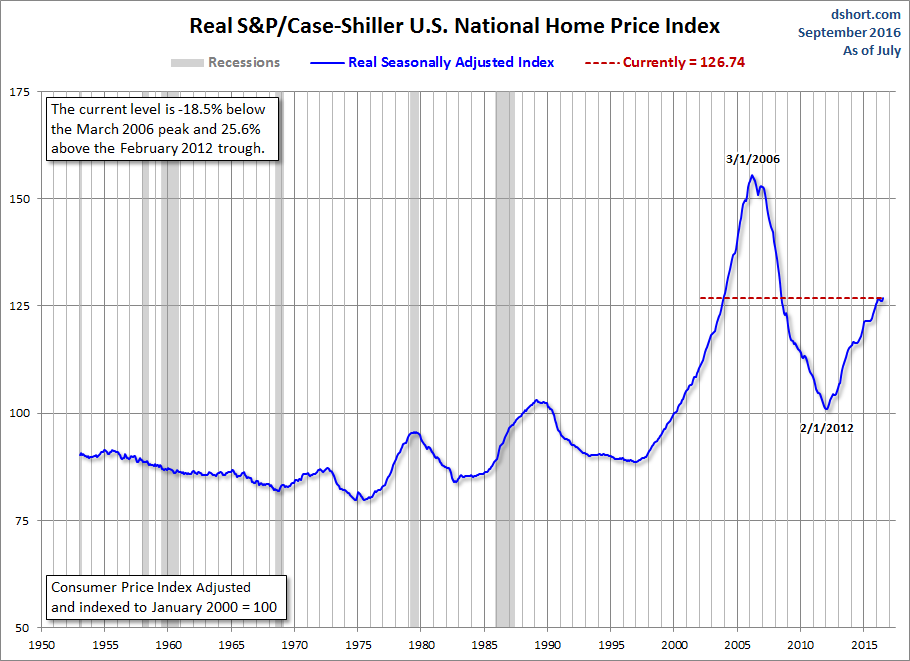
For a long-term perspective on home prices, here is a look at the seasonally and inflation-adjusted Case-Shiller price index from 1953, the first year that monthly data is available. Because the CPI owners' equivalent rent of residences didn't start until 1983, we've used the broader seasonally adjusted Consumer Price Index.
(Click on image to enlarge)
Disclosure: None.


Thanks for sharing