
Home Builder Giant M/I Homes Is The Top Upgrade For This Week
For today's edition of our upgrade list, we searched for upgrades to "buy" or "strong buy" with complete forecast and valuation data. They are presented by one-month forecast return. Home-building giant M/I Homes (MHO) Redwood Trust (RWT ) is our top-rated upgrade this week and it is a "strong buy". Magnachip Semiconductor, the number two upgrade this week, is also a "strong buy". The other components in our list are BUY-rated companies.
|
Ticker |
Company Name |
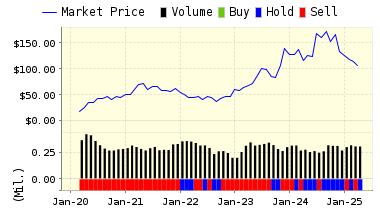
Market Price |
Valuation |
Last 12-M Return |
1-M Forecast Return |
1-Yr Forecast Return |
P/E Ratio |
Sector Name |
|
M/I HOMES INC |
26 |
2.92% |
47.48% |
1.10% |
13.17% |
10.04 |
Construction |
|
|
MAGNACHIP SEMI |
8.65 |
17.74% |
97.49% |
1.08% |
13.03% |
14.66 |
Computer and Technology |
|
|
CONNECTONE BCP |
25.85 |
22.05% |
58.88% |
0.77% |
9.20% |
16.79 |
Finance |
|
|
TUPPERWARE BRND |
58 |
3.72% |
31.91% |
0.71% |
8.48% |
13.46 |
Consumer Staples |
|
|
GAIN CAP HLDGS |
7.58 |
16.80% |
16.26% |
0.58% |
7.01% |
10.11 |
Finance |
Below is today's data on M/I Homes, Inc. (MHO):
M/I Homes, Inc. is one of the nation's leading builders of single-family homes. Their homes are marketed and sold under the trade names M/I Homes and Showcase Homes. They have homebuilding operations in Columbus and Cincinnati, Ohio; Indianapolis, Indiana; Tampa, Orlando and Palm Beach County, Florida; Charlotte and Raleigh, North Carolina; Virginia and Maryland.
Recommendation: We updated our recommendation from BUY to STRONG BUY for M/I Homes on 2017-01-27. Based on the information we have gathered and our resulting research, we feel that M/I Homes has the probability to outperform an average market performance for the next year. The company exhibits attractive P/E Ratio and Price Sales Ratio.
|
ValuEngine Forecast |
||
|
Target |
Expected |
|
|---|---|---|
|
1-Month |
26.28 | 1.10% |
|
3-Month |
26.44 | 1.69% |
|
6-Month |
26.77 | 2.95% |
|
1-Year |
29.42 | 13.17% |
|
2-Year |
26.21 | 0.82% |
|
3-Year |
25.12 | -3.39% |
|
Valuation & Rankings |
|||
|
Valuation |
2.92% overvalued |
Valuation Rank |
|
|
1-M Forecast Return |
1.10% |
1-M Forecast Return Rank |
|
|
12-M Return |
47.48% |
Momentum Rank |
|
|
Sharpe Ratio |
0.63 |
Sharpe Ratio Rank |
|
|
5-Y Avg Annual Return |
19.29% |
5-Y Avg Annual Rtn Rank |
|
|
Volatility |
30.82% |
Volatility Rank |
|
|
Expected EPS Growth |
16.22% |
EPS Growth Rank |
|
|
Market Cap (billions) |
0.64 |
Size Rank |
|
|
Trailing P/E Ratio |
10.04 |
Trailing P/E Rank |
|
|
Forward P/E Ratio |
8.64 |
Forward P/E Ratio Rank |
|
|
PEG Ratio |
0.62 |
PEG Ratio Rank |
|
|
Price/Sales |
0.39 |
Price/Sales Rank |
|
|
Market/Book |
1.01 |
Market/Book Rank |
|
|
Beta |
1.06 |
Beta Rank |
|
|
Alpha |
0.04 |
Alpha Rank |
|
Market Overview
|
Summary of VE Stock Universe |
|
|
Stocks Undervalued |
33.31% |
|
Stocks Overvalued |
66.69% |
|
Stocks Undervalued by 20% |
14.43% |
|
Stocks Overvalued by 20% |
34.21% |
Sector Overview
|
Sector |
Change |
MTD |
YTD |
Valuation |
Last 12-MReturn |
P/E Ratio |
|
Industrial Products |
0.07% | 3.80% | 3.80% | 23.02% overvalued | 38.56% | 25.31 |
|
Multi-Sector Conglomerates |
-0.51% | 3.36% | 3.36% | 19.89% overvalued | 29.90% | 20.30 |
|
Transportation |
-0.26% | 5.79% | 5.79% | 18.93% overvalued | 34.23% | 19.05 |
|
Oils-Energy |
-0.64% | 4.07% | 4.07% | 17.57% overvalued | 51.48% | 28.61 |
|
Basic Materials |
0.55% | 8.70% | 8.68% | 17.35% overvalued | 93.54% | 29.61 |
|
Aerospace |
0.44% | 2.23% | 2.23% | 16.82% overvalued | 29.32% | 20.78 |
|
Finance |
-0.35% | 1.45% | 1.45% | 16.35% overvalued | 26.02% | 18.13 |
|
Construction |
-0.39% | 2.94% | 2.94% | 15.57% overvalued | 43.55% | 21.16 |
|
Business Services |
-0.20% | 1.78% | 1.78% | 13.06% overvalued | 20.41% | 24.49 |
|
Computer and Technology |
0.15% | 4.40% | 4.98% | 12.65% overvalued | 26.59% | 30.94 |
|
Utilities |
0.01% | 2.66% | 2.66% | 11.85% overvalued | 26.08% | 22.25 |
|
Auto-Tires-Trucks |
-0.28% | 2.87% | 2.87% | 9.34% overvalued | 40.59% | 15.02 |
|
Consumer Staples |
-0.08% | 1.80% | 1.80% | 7.18% overvalued | 15.92% | 23.87 |
|
Consumer Discretionary |
-0.13% | 1.50% | 1.50% | 6.91% overvalued | 26.55% | 24.04 |
|
Retail-Wholesale |
-0.80% | -1.40% | -1.40% | 0.18% undervalued | 11.64% | 22.82 |
|
Medical |
0.12% | 4.05% | 4.05% | 4.30% undervalued | 7.33% | 28.15 |
Disclaimer: ValuEngine.com is an independent research ...
more

