
Holding Stocks In A Rising Rate Environment
There’s a whiff of change in the air and it’s coming from the debt market. Recent price action in the ProShares Short 7-10 Year Treasury (NYSE Arca: TBX) seems to herald higher rates on the right side of the yield curve.
Specifically, there’s a head-and-shoulders bottom formation in the exchange-traded fund’s chart, a fairly reliable indicator of bullish pricing to come. Since TBX is an inverse fund, “bullish” means lower T-note prices and, consequently, higher yields.
Head-and-shoulder formations are statistically the most accurate price patterns known to market technicians, reaching their projected price objectives almost 85 percent of the time.
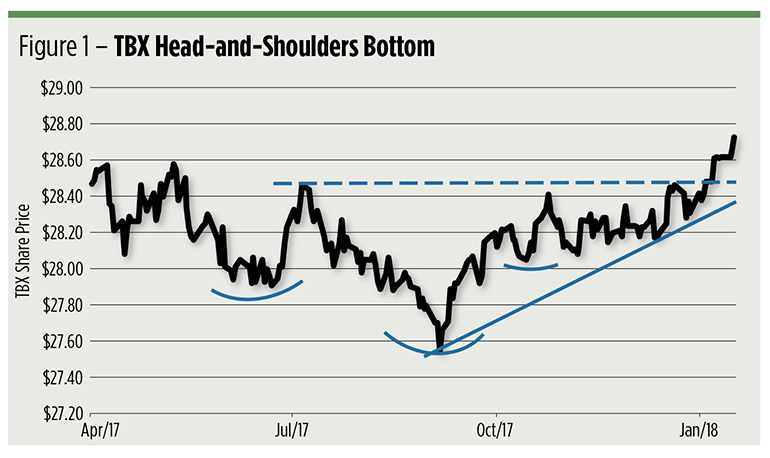
The pattern signals a trend reversal and is defined by two swing lows (the shoulders) bracketing an even deeper low (the head). If prices rebound from the right shoulder to cross above the pattern’s so-called neckline, the security’s price can be expected to reach a level as high above the neckline as the head was below it. The neckline is scribed by the dotted line in Figure 1
So, should you short the 10-year Treasury note by purchasing TBX? Well, you certainly could, but you don’t want to miss the broader point: the impact rising interest rates may have on your stock portfolio.
Generally speaking, equity prices and bond yields are inversely correlated, so the upward trajectory projected for TBX could foretell some wobbling in the presently bullish stock trend. That’s no reason to abandon equities altogether but it’s enough of a concern to wonder if there’s a way to comfortably hold stocks in a rising rate environment. Three ETF sponsors seem to think you can.
Back in 2015, Invesco introduced the PowerShares S&P 500 ex-Rate Sensitive Low Volatility ETF (NYSE Arca: XRLV ) to track a hundred S&P 500 constituents with the lowest interest rate risk. True to its name, XRLV is also a low-vol product. In fact, its stocks are ultimately weighted in the portfolio inversely by their volatilities with the least volatile issues receiving the highest weights. First, though, stocks are screened for their interest rate sensitivity by comparing their five-year performance to 10-year Treasurys. Only those issues that fare relatively well when yields rise get passed through to the volatility test. The index portfolio is rebalanced and reconstituted quarterly to keep it attuned to changing market conditions.
XRLV’s portfolio looks radically different than the S&P 500 as proxied by SPDR S&P 500 ETF (NYSE Arca: SPY). The low-vol portfolio’s largest sector exposures are financials and industrials versus SPY’s concentration in the highly volatile information technology sector. Top weighting in the XRLV portfolio is given over to Honeywell International Inc. (NYSE: HON), Coca-Cola Co. (NYSE: KO) and Berkshire Hathaway (NYSE: BRK-B ) versus SPY’s big three of Apple Inc. (Nasdaq: AAPL), Microsoft Corp. (Nasdaq: MSFT) and Amazon.com Inc. (Nasdaq: AMZN). The dispersion in the two portfolios is also quite different. XRLV’s top three issues take up just 4 percent of its portfolio weight; SPY’s top three weigh in at 9 percent. Clearly, XRLV conveys more concentration risk.
All this has paid off in outperformance. XRLV has generated an 11.8 percent annual growth rate versus SPY’s 7.9 percent. Given XRLV’s dual mandate, it’s hard to ascribe the fund’s excess return to low volatility or to interest rate sensitivity. For the first year of the ETF’s life, 10-year Treasury rates were downtrending while XRLV and SPY pitched and bucked ahead of the 2016 elections. Still, there’s little doubt that the low-vol ETF’s .82 beta contributed to its 5.19 alpha coefficient. You can hold the fund for an annual cost of 25 basis points (0.25 percent) while earning a 1.34 percent annual dividend yield.
A wider mandate is held by the Fidelity Dividend ETF for Rising Rates (NYSE Arca: FDRR). Introduced in late 2016, FDRR’s portfolio draws in large- and mid-cap companies from developed nations that exhibit strong dividend characteristics and positive correlations to 10-year U.S. Treasury yields.
FDRR’s selection universe is 2,000 stocks wide – half from the U.S., half off-shore – and taps those issues with the highest dividend yields, dividend payout ratios, and dividend growth rates along with their sympathy to interest rate increases. Ultimately, the fund’s methodology focuses investment in domestic issues. In its 123-stock modified capitalization-weighted portfolio, there’s a 10 percent limit on international stocks and a 35 percent cap on any individual industry sector. Presently, the portfolio tilts 94 percent toward U.S. stocks and its largest sector exposure – currently at 23 percent – is to information technology. The fund also has outsized exposure to financial stocks. FDRR’s top holdings are Apple Inc. (Nasdaq: AAPL), Microsoft Corp. (Nasdaq: MSFT) and Johnson & Johnson (NYSE: JNJ) which are held in larger concentrations than in the SPY portfolio.
Over its lifetime, FDRR has lagged the domestic market represented by SPY. It’s highly correlated to the S&P 500 portfolio (r2 = 86.09) and has earned a negative alpha of -4.19 since 2016. A significant contributing factor to FDRR’s underperformance is the ETF’s volatility vis-à-vis the S&P 500. With a 1.14 beta, FDRR hasn’t been exactly a low-vol play.
At 29 basis points, FDRR’s expense ratio is slightly higher than XRLV’s but outdoes the low-vol ETF with a 2.77 percent annual dividend yield.
The latest entry to the field, the ProShares Equities for Rising Rates (Nasdaq: EQRR ) debuted in July 2017 and takes a sector approach to the interest rate issue. EQRR’s selection universe is populated by 500 of the largest-cap U.S. stocks. Its index methodology selects five industry sectors most positively correlated with weekly changes in the 10-year Treasury yield over the preceding three years, then picks 10 stocks for each sector with the highest individual correlations to the 10-year rate. Each sector equally weights its 10 components, but the heft of each sector in the EQRR portfolio is tied to its correlation to the government note. The most highly correlated sector receives a 30 percent weighting while the others take up 25, 20, 15 and 10 percent weights in each quarterly rebalancing.
EQRR is the priciest rising rate ETF by dint of its 35 basis point expense ratio. Dividends were last clocked at 1.53 percent.
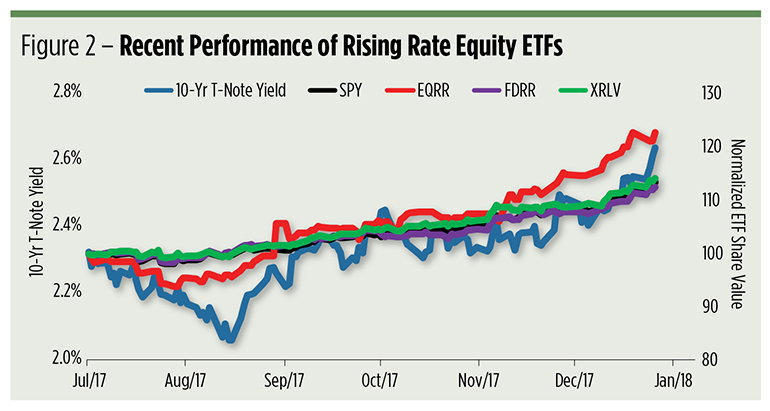
On a day-to-day basis, you can’t say EQRR is well-correlated to gyrations in the 10-year Treasury yield. That’s made plain in Figure 2. Note that there are plenty of days in which the ETF price and the note yield actually moved in opposite directions. Still, in the longer term, their trajectories are quite similar.
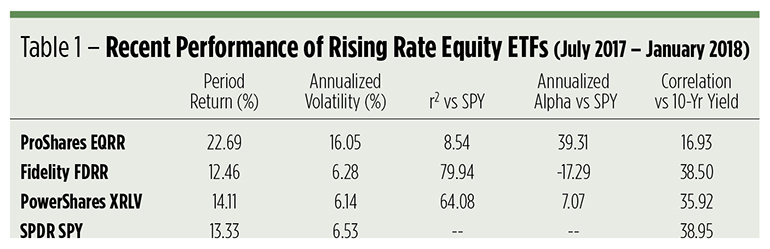
What’s most evident in Figure 2 (and Table 1 as well) is the similarity of the older rising rate ETFs to the large-cap market represented by SPY. That has implications for investors and advisors building portfolios. Admittedly, this is a small window – it’s just the lifespan of the nascent EQRR – but it represents a critical time frame for these ETFs. Since EQRR was first floated, the 10-year T-note yield’s risen more than 30 basis points including an intervening two-month decline. If this pattern holds in the future, EQRR can be expected to provide a greater diversification benefit to portfolio builders than the older funds.
So, how are investors or their advisors likely to use these ETFs in portfolio? That depends, in great part, on which fund is selected for inclusion. The EQRR portfolio seems likely to provide a greater diversification benefit. That said, it’s better suited as a complimentary or tactical position to augment core equity holdings. Because of their stronger correlations to the S&P 500, the other ETFs – and in particular, XRLV – could actually be used as a core holding.
Daily trading in these ETFs, especially EQRR can be spare, but spreads are usually tolerable. Because of the liquidity of the underlying stocks, decent executions are obtainable, but limit orders may help to avoid surprises.
The most important consideration for investors using these ETFs is interest rate risk. While these portfolios seek to outperform traditional cap-weighted funds during periods of rising rates, investors should expect underperformance when rates are downtrending.
Disclosure: Brad Zigler pens Wealthmanagement.com's Alternative Insights newsletter. Formerly, he headed up marketing and research for the Pacific Exchange's (now NYSE Arca) option ...
more

