
Head And Shoulders
- SPX Monitoring purposes; Covered short SPX 1/31/17 at 2278.87 =.09% gain; Short on 1/30/17 at 2280.90
- Monitoring purposes Gold: Long GDX on 12/28/16 at 20.25.
- Long Term Trend monitor purposes: Short SPX on 1/13/16 at 1890.28

Equity Put/Call ratio (CPCE) closed Monday at .75. CPCE readings of .75 and higher predict a higher market 88% of the time with an averaging 1.3% in the next five days. The pattern that formed on the SPY from mid December to mid January could be a head and Shoulders bottom pattern. This pattern has a measured target near 131. Minor bounce is possible that could lead to a sell signal in the coming days. Covered short SPX = gain .09%, back to neutral.
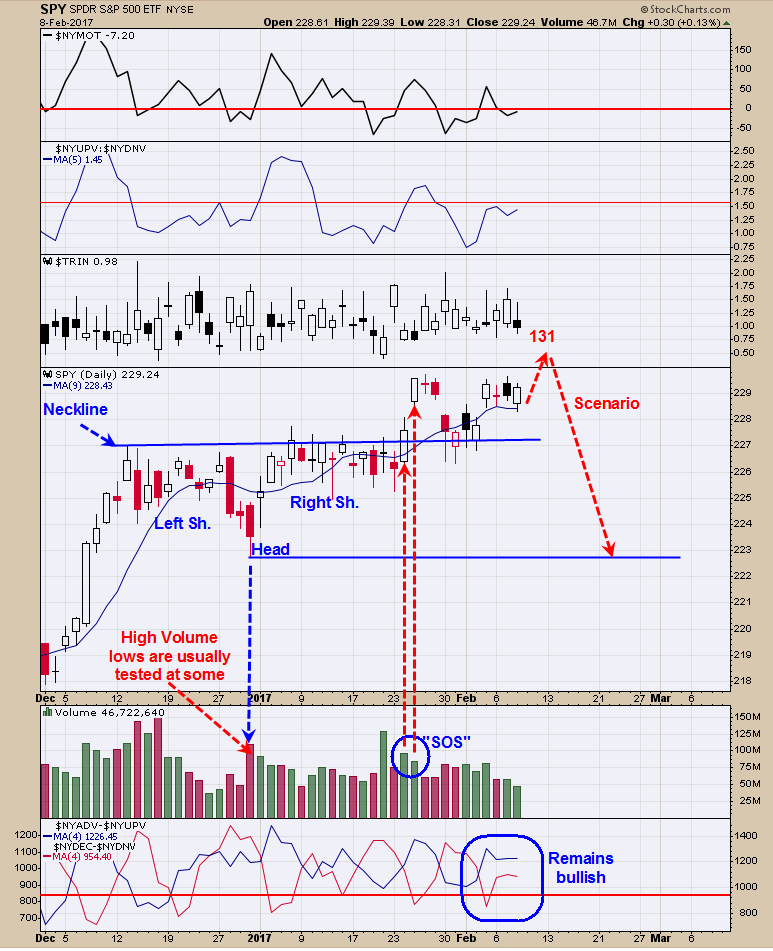
The NYA is running into the 2015 top and finding resistance. The above chart is a short term view of what may develop in the coming days. The above chart is the daily SPY. It appears a Head and Shoulders bottom pattern formed where the Head is the Late December low. The Neckline was broken with a “Sign of Strength” (SOS) and confirmed the Head and Shoulders pattern. This Head and Shoulders pattern has a measured target near 131 which hasn’t been hit yet and could be where the market is heading and where a potential top form. We will keep our powder dry for now.
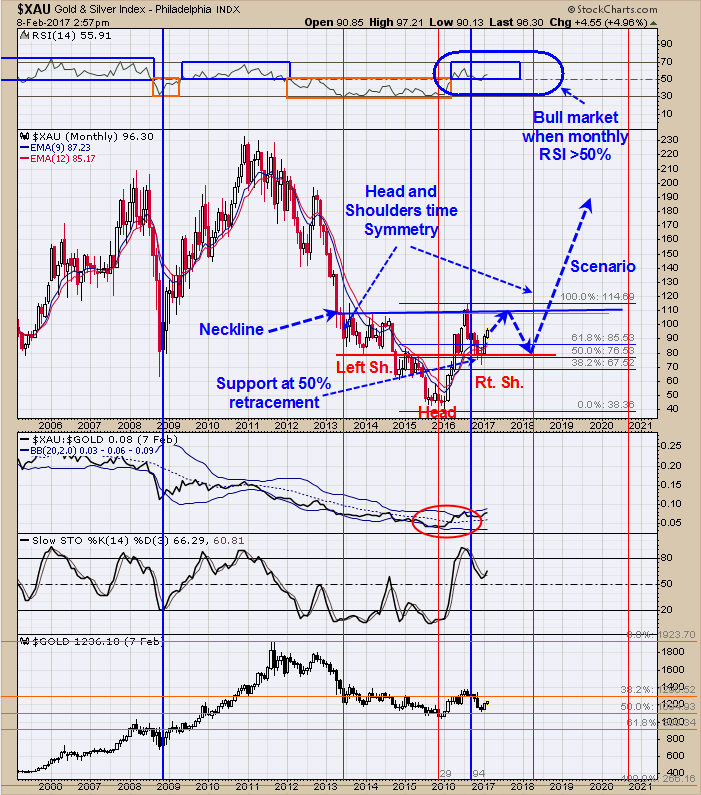
Above is the monthly XAU chart. XAU form the August 2016 to the December low produced a 50% retracement of the previous rally that started January 2016. XAU found support near the 75 range and is now in the rally mode. The next obvious resistance is the August high near 110 which for now is our upside target and an area where market may stall. The pattern that appears to be forming is a Head and Shoulders bottom pattern. This pattern has symmetry both in time and price. If one measures in time from Head to the start of the left Shoulder it should be near equal in time from Head to the end of the Right Shoulder (Red vertical lines) which comes in early 2018. So this year could end up sideways (but with big swings) creating the Right Shoulder. If this potential Head and Shoulders pattern places out then Next year could be the banner year for gold stocks as the Head and Shoulders pattern breakout would come next year. The top window is the monthly RSI for the XAU. As long as the Monthly RSI stays above 50 range, than bull market is present. Long GDX on 12/28/16 at 20.25.


Thanks for sharing