Got Stocks? And Heartburn?
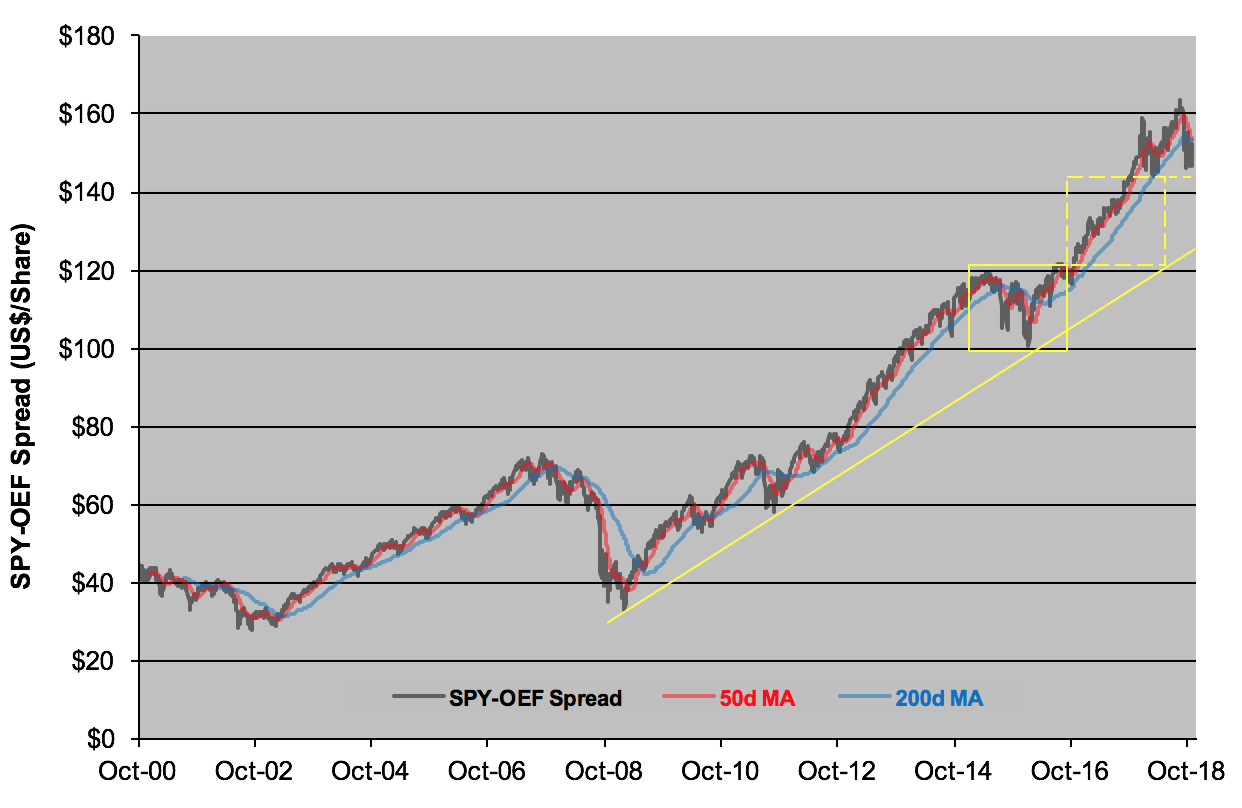
These are definitely nerve-wracking times for stock investors. Last week was particularly trying as the chart below illustrates.
(Click on image to enlarge)

Can’t see what I’m talking about? Zoom into the upper right corner and you may be able to detect the red line crossing below the blue line. That’s a sign of flagging momentum and usually foretells further weakness ahead.
The red and blue lines depict moving averages—50-day and 200-day, respectively—of the SPY-OEF spread. SPY, of course, is the SPDR S&P 500 ETF (NYSE Arca: SPY), the original ETF proxy for the S&P 500 Composite. The other component of the spread is the iShares S&P 100 ETF (NYSE Arca: OEF), a portfolio made up of the S&P 500’s 100 largest names. Think of SPY as a large-cap fund and OEF as a package of mega caps.
So, what’s with the spread? It’s merely the difference in the ETFs’ market prices. SPY has always traded at a premium to OEF, but that premium widens and contracts in sync with investors’ moods. When OEF was launched in 2000, SPY’s share price was about $46 higher than OEF’s. The premium’s swelled to more than $152 now, but you can see from the chart that the spread’s trajectory features more than a few bumps and dips.
Generally speaking, the spread expands in good times and contracts when investors become defensive. In other words, SPY’s stocks (large caps) gain relative to OEF’s (mega caps) when investors feel flush. OEF’s stocks, on the other hand, are favored by punters pulling in their horns.
Since the S&P 500 reached its September zenith, SPY’s fallen 6.1 percent while OEF’s given up 5.5 percent, significantly narrowing SPY’s premium. On Thursday, the “death cross” appeared as the spread’s 50-day average sunk below its 200-day mean. The last time that occurred was in August 2015, leading to a 6.2 percent swoon in the S&P 500. If history repeats itself, such a move could clearly put the blue-chip index in correction territory. Technically, in fact, the SPY-OEF spread is setting up a test of the $130-$132 level, foreshadowing a further 13 percent drop to the 2,400 area in the S&P 500.
Nothing’s guaranteed, of course, but the case for a correction in the U.S. equity market is becoming more compelling by the day. After all, this is a very OLD bull. What to do? First of all, diversify your portfolio risk as much as possible. Equity-oriented investors may want to look abroad or to focus on defensive stocks for their domestic exposure. We recently highlighted the consumer staples sector, for example, as a refuge for wary investors.
And for smaller players? Maybe investing in a package of TUMS antacid tabs through their neighborhood Walmart (NYSE: WMT) or Walgreen’s (NYSE: WBA) – both major components of the Consumer Staples Select Sector SPDR (NYSE Arca: XLP) – will suffice.
Disclosure: None.


