
Gold Rebound Vulnerable To Hawkish Fed Rhetoric
GOLD TALKING POINTS
Gold extends the rebound from the 2018-low ($1160) amid the recent weakness in the U.S. dollar, and the precious metal may continue to gain ground over the coming days as it initiates a fresh series of higher highs & lows.
GOLD REBOUND VULNERABLE TO HAWKISH FED RHETORIC

The inverse relationship between gold and the greenback continues to take shape despite the growing spat between Turkey and the U.S., and the current environment may foster a larger recovery in the precious metal as there appears to be waning expectations for four Fed rate-hikes in 2018.
Lackluster data prints coming out of the U.S. economy may spark a further shift in market expectations as consumer sentiment unexpectedly wanes in August, but the FOMC Minutes and the Fed’s Economic Symposium in Jackson Hole, Wyoming may boost the appeal of the dollar should Chairman Jerome Powell & Co. insist that ‘the Committee expects that further gradual increases in the target range for the federal funds rate will be consistent with sustained expansion of economic activity, strong labor market conditions, and inflation near the Committee's symmetric 2 percent objective over the medium term.
It seems as though the FOMC will stick to its hiking-cycle as the central bank largely achieves its dual mandate for full employment and price stability, and a batch of hawkish comments may undermine the recent rebound in gold if Fed officials show a greater willingness to implement four rate-hikes in 2018.
(Click on image to enlarge)
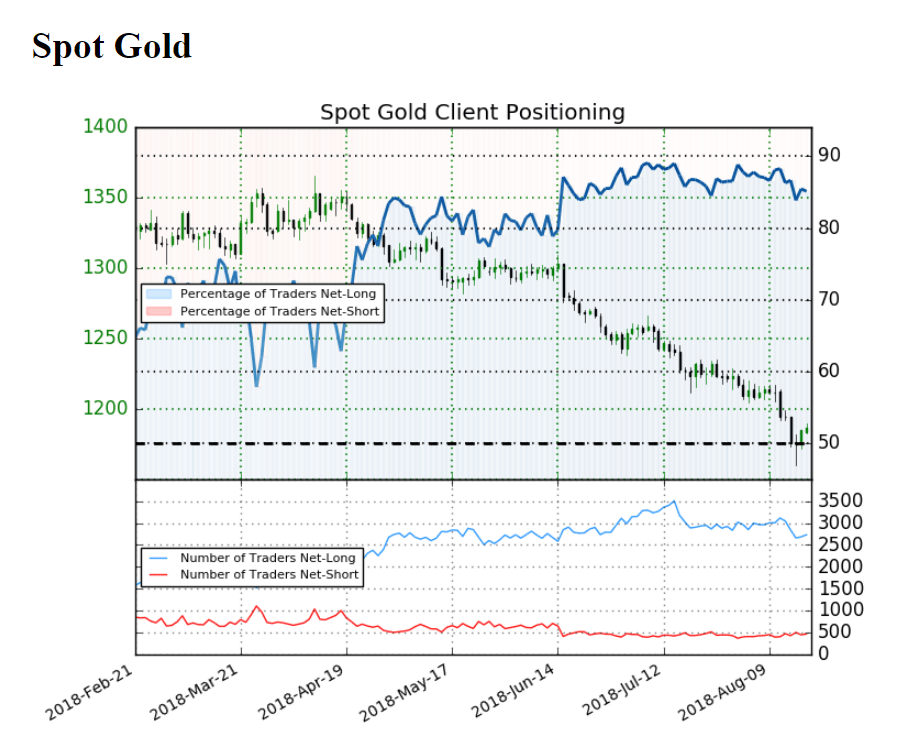
Keep in mind, the IG Client Sentiment Report continues to show retail sentiment near extremes as 85.1% of traders remain net-long gold, with the ratio of traders long to short at 5.72 to 1. The number of traders net-long is 0.1% higher than yesterday and 13.4% lower from last week, while the number of traders net-short is 5.9% lower than yesterday and 14.4% higher from last week.
With that said, the ongoing slant in retail positioning offers a contrarian view to crowd sentiment, with the broader outlook for gold still tilted to the downside as both price and the Relative Strength Index (RSI) extend the bearish formations from earlier this year.
GOLD DAILY CHART
(Click on image to enlarge)
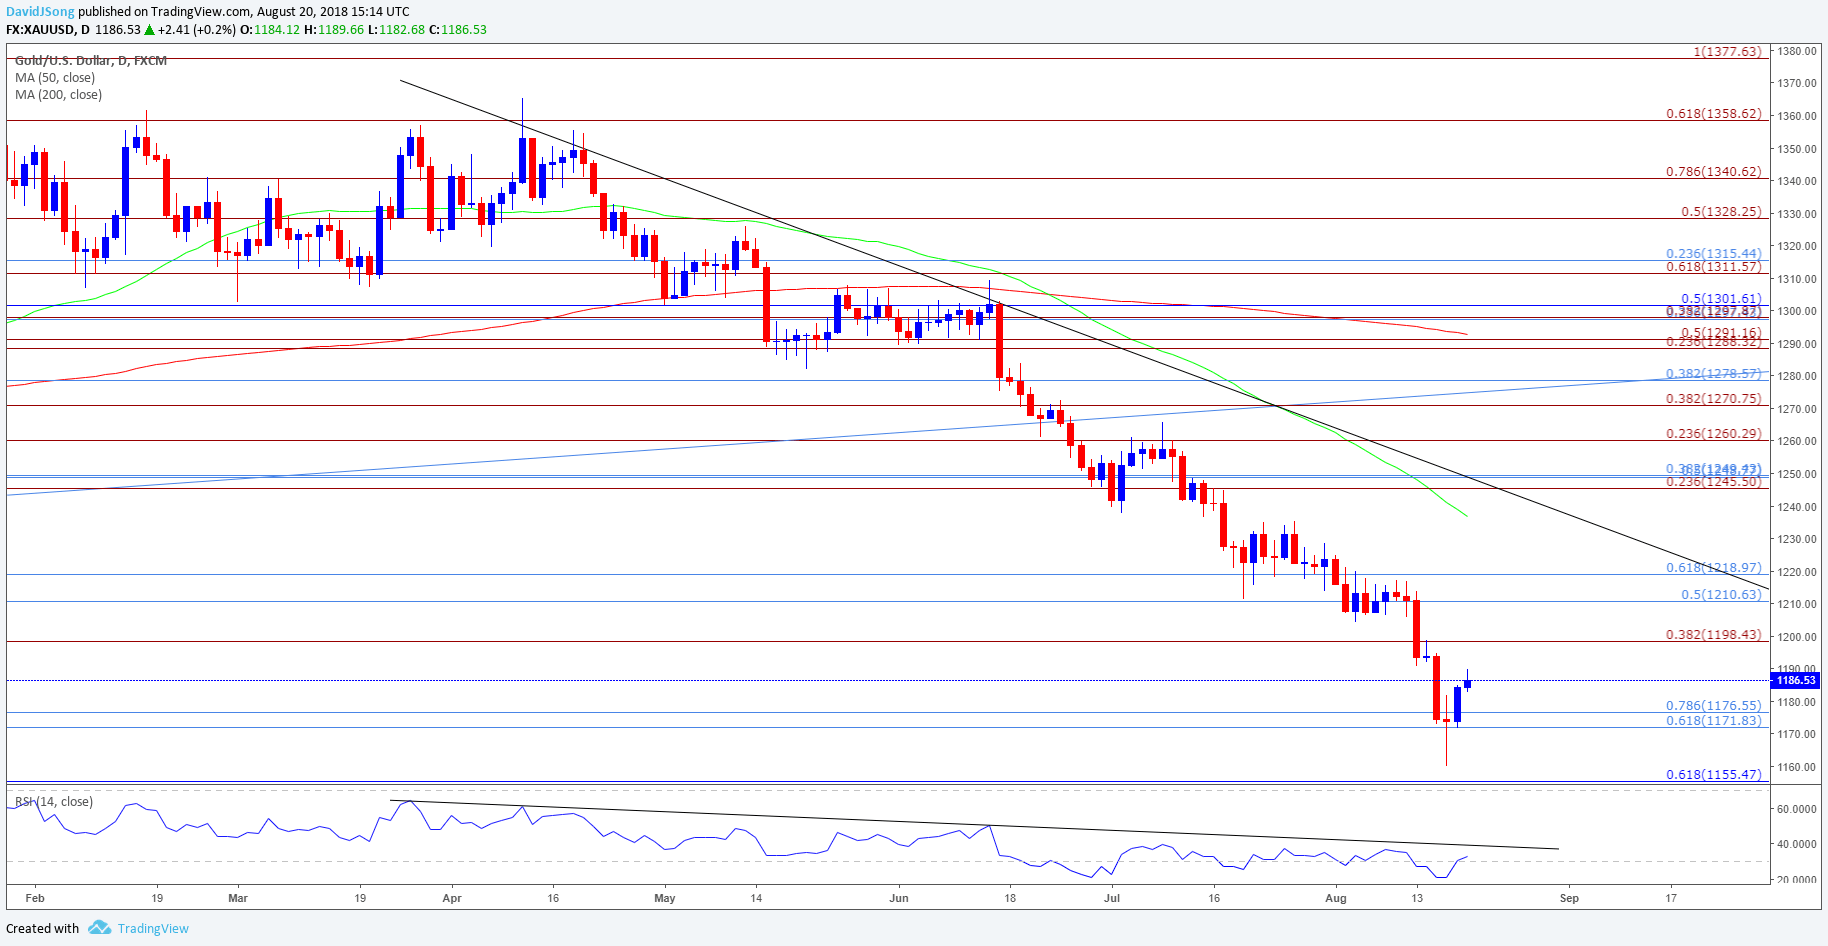
- Nevertheless, recent price action warns of a larger recovery as gold carves a series of higher highs & lows, with the RSI highlighting a similar dynamic as it comes off of oversold territory.
- The failed attempt to break/close below the $1155 (61.8% retracement) hurdle raises the risk for a move back towards $1198 (38.2% expansion), with the net region of interest coming in around $1211 (50% retracement) to $1219 (61.8% retracement).
- Need a closing price below the Fibonacci overlap around $1172 (61.8% retracement) to $1177 (78.6% retracement) to bring the downside targets back on the radar.


