
Gold Prices Rise As US Dollar Sinks, Crude Oil Eyes OPEC Meeting
Gold prices managed to secure an upswing as the supportive influence of a weaker US Dollar outweighed headwinds from rising yields. Ebbing haven demand appears to have accounted for the greenback’s weakness. It fell alongside Treasury bonds while stocks surged.
Pre-positioning ahead of next week’s FOMC monetary policy announcement (admittedly not of the kind expected) might account for the move. A rate hike is all but fully priced in for this month and the probability of another on in December now stands at a formidable 80 percent.
On balance, that creates more scope for volatility in the event that the Fed surprises on the dovish rather than the hawkish side. That probably made for a strong impetus to unwind exposure considering the latest COT statistics put speculative positioning at its most net-long in 16 months.
Meanwhile, crude oil prices fell as US President Trump took OPEC to task via Twitter, saying it “must get prices down now!” Iran railed against the creation of a US-friendly OPEC alternative, lending credence to reports of such efforts being underway. Russian output was also said to have hit a post-Soviet high.
MARKETS LOOK AHEAD TO OPEC MEETING, FOMC
Preemptive portfolio rebalancing is likely to remain an important catalyst for price action in the final hours of the trading week. Crude oil will look ahead to the weekend’s meeting of the OPEC Joint Technical Committee in Algiers while gold will probably continue to focus on next week’s Fed conclave.
What this means in terms of directional bias is unclear. For oil, reluctance to hold exposure over the weekend may translate into standstill until the outcome of OPEC’s gathering is made known. Gold may be similarly indecisive, though another supportive risk-on swell should not be discounted.
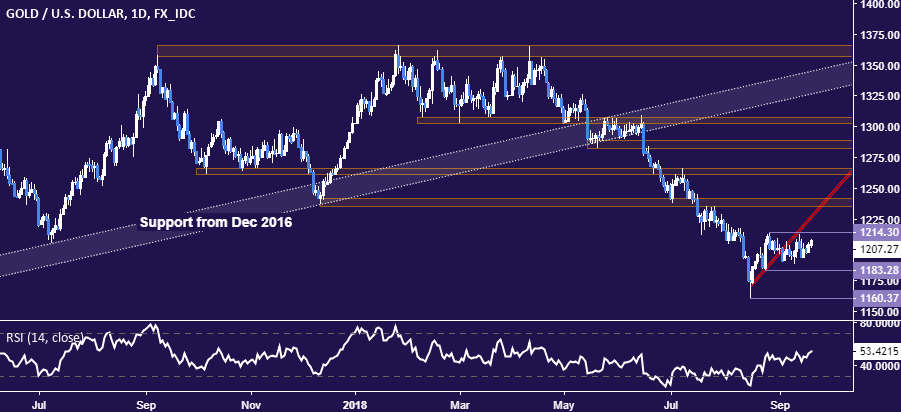
GOLD TECHNICAL ANALYSIS
Gold prices remain confined to a familiar range below August 28 high at 1214.30. A break above this boundary confirmed on a daily closing basis opens the door for a retest of support-turned-resistance in the 1235.24-41.64 area. Alternatively, a breach of its lower bound – marked by the August 24 low at 1183.28 – sees the next downside barrier at 1160.37, the latest swing bottom.
(Click on image to enlarge)
CRUDE OIL TECHNICAL ANALYSIS
Crude oil prices pulled back to retest former resistance in the 70.15-41 area, now recast as support. A daily close back below it targets rising trend support in the 65.69-67.50 zone. Alternatively, a push above the next layer of resistance marked by the chart inflection point at 72.88 paves the way for a challenge of defining support-turned-resistance in the 75.00-77.31 region.
(Click on image to enlarge)

Disclosure: Do you want to see how retail traders are currently trading the US Dollar? Check out our IG Client Sentiment ...
more

