
Gold Prices May Fall Further On US Retail Sales Report
Gold prices turned lower amid a recovery in risk appetite. Investors’ chipper mood reflected easing geopolitical concerns after senior US officials – including the heads of State and Defense departments as well as the national security advisor and the Director of the CIA – sought to de-escalate tensions between the US and North Korea following last week’s fiery rhetoric.
Treasury bond yields rose alongside stock prices, sapping demand for non-interest-bearing assets including the yellow metal. Easing fears about politically-inspired instability were also read as increasing the probability of further Fed tightening. The implied 2017 rate hike path steepened and the US Dollar duly rose, undermining the relative appeal of anti-fiat alternatives.
Crude oil prices dropped after China said oil refining dropped 4.4 percent in July, marking the largest fall since 2014, while EIA projected that US shale output will hit an all-time high of 6.15 million barrels per day in September. Signs of ebbing demand from the world’s largest crude consumer and swelling output from its most significant swing supplier seemingly dented prospects for reducing a global supply glut.
Looking ahead, US retail sales data may compound gold selling pressure if the numbers echo a broad improvement in economic data outcomes since mid-June, boosting Fed stimulus withdrawal bets. Meanwhile, crude oil will look to the weekly set of API inventory flow figures for direction. By way of context, official EIA statistics due Wednesday are seen showing a 3.5 million barrel drawdown.
GOLD TECHNICAL ANALYSIS – Gold prices put in a bearish Evening Star candlestick pattern below double top resistance in the 1293.90-95.46 area (61.8% Fibonacci expansion, double top), hinting a turn lower may be ahead. A daily close below the 14.6% Fib retracement at 1279.36 exposes the 23.6% level at 1271.53. Alternatively, a push above 1295.46 targets the 76.4% expansion at 1303.98.
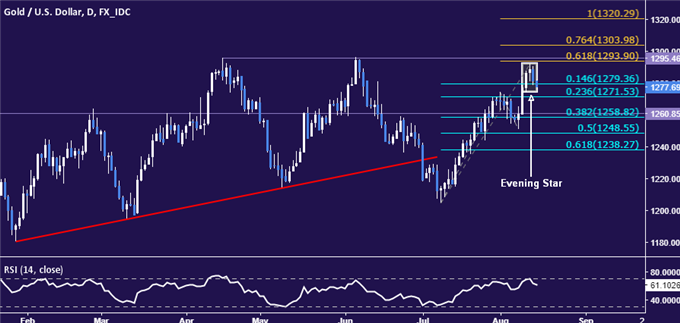
Chart created using TradingView
CRUDE OIL TECHNICAL ANALYSIS – Crude oil prices appear to have broken rising trend line support set from the June swing low, hinting a two-month uptrend has been overturned. From here, a daily close below the 23.6% Fibonacci expansion at 47.30 targets the 38.2% level at 45.38. Alternatively, a move back above the 14.6% Fib at 48.48 opens the door for a retest of the August 1 high at 50.40.
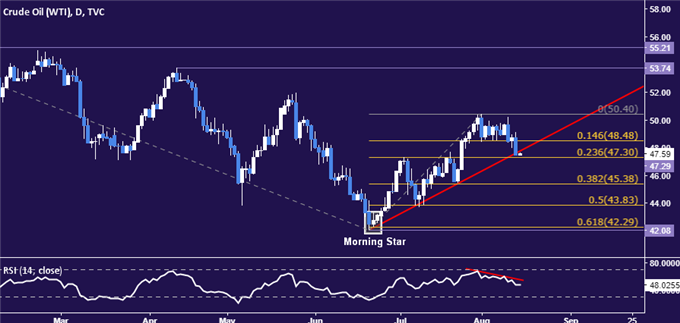
Chart created using TradingView


