
Gold Prices May Fall As Trump, Junker Strike Deal On Auto Tariffs
Gold prices made little headway yesterday. A narrow pullback in the US Dollar offered support to the benchmark anti-fiat asset early in the session but follow-through proved lacking, with traders seemingly unwilling to commit ahead of incoming event risk. The spotlight is on a meeting between US President Donald Trump and EC President Jean-Claude Junker in the day ahead.
Mr Junker arrives at the White House on a mission to dissuade Mr Trump from moving forward with proposed tariffs on auto imports. US Department of Commerce hearings showed the duties are deeply unpopular domestically last week, hinting the President may be keen to scrap them. If Junker is able to capitalize on this and cobble together an accord, rising bond yields may hurt the yellow metal as risk appetite firms.
CRUDE OIL PRICES MAY RISE AS US INVENTORIES DROP
Crude oil prices edged up as the EIA predicted rising demand from China, India and Africa through 2040 in its International Energy Outlook report while API data showed US stockpiles fell last week. The private-sector estimate saw 3.16 million barrel outflow from crude storage. Gasoline and distillate stocks shed 4.87 million and 1.32 million barrels respectively.
Official DOE inventory statistics due to cross the wires today are expected to produce more modest results. Economists envision drawdowns of 2.2 and 1.2 million barrels from crude and gasoline storage respectively while distillate stocks post a modest gain. Outcomes closer to the API projection may offer prices a further boost. A risk-on lead from the Trump/Junker meeting may add to upward pressure.
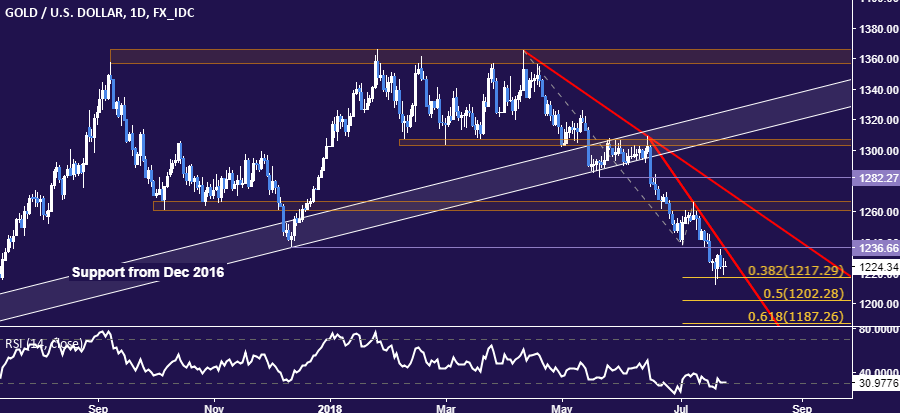
GOLD TECHNICAL ANALYSIS
Gold prices remained pinned to support marked by 38.2% Fibonacci expansion at 1217.29. A daily close below it initially targets the 50% Fib at 1202.28. Alternatively, rebound above support-turned-resistance at 1236.66 paves the way for another challenge of the 1260.80-66.44 area.
(Click on image to enlarge)
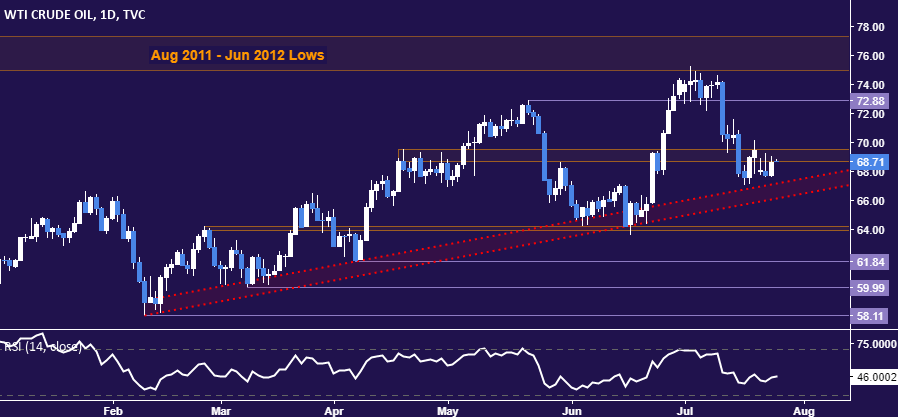
CRUDE OIL TECHNICAL ANALYSIS
Crude oil prices continue to tread water near support set from early February, now at 66.17. A break below this barrier exposes the 63.96-64.26 area. Alternatively, a daily close above the 68.74-69.53 zone opens the door for a test back above $72/bbl figure.
(Click on image to enlarge)
Disclosure: Do you want to see how retail traders are currently trading the US Dollar? Check out our IG Client Sentiment ...
more

