
Gold Prices May Fall As Cooling Italy Fears Boost Yields, US Dollar
Gold prices surged as turmoil in Italy soured risk appetite, weighing on bond yields and boosting the relative appeal of non-interest-bearing assets epitomized by the yellow metal. The markets scrambled after Italian lower house budget committee head Claudio Borghi said Rome could solve its fiscal problems if it were to have its own currency. Crude oil prices languished in digestion mode after yesterday’s fireworks.
GOLD MAY FALL IN RISK-ON TRADE, EIA DATA ON TAP
Looking ahead, an upturn in risk appetite may send gold lower anew. Prices held up in Asia Pacific trade as Italy stepped back from the brink, triggering a surge in EUR/USD that echoed as broader US Dollar weakness. That helped underpin anti-fiat alternatives but support may evaporate as ebbing Eurozone instability worries boost yields and reinforce Fed rate hike prospects. Indeed, S&P 500 futures are pointing upward.
Meanwhile, EIA inventory flow data will be in focus for crude oil prices. Economists expect to see that stockpiles added 876.8k barrels last week. Analogous API data published yesterday registered a gain of 907k million barrels, making the case for a broadly in-line outcome. That may translate into another day of inconclusive trade, particularly if the influence of risk-on flows clashes with that of a stronger greenback.
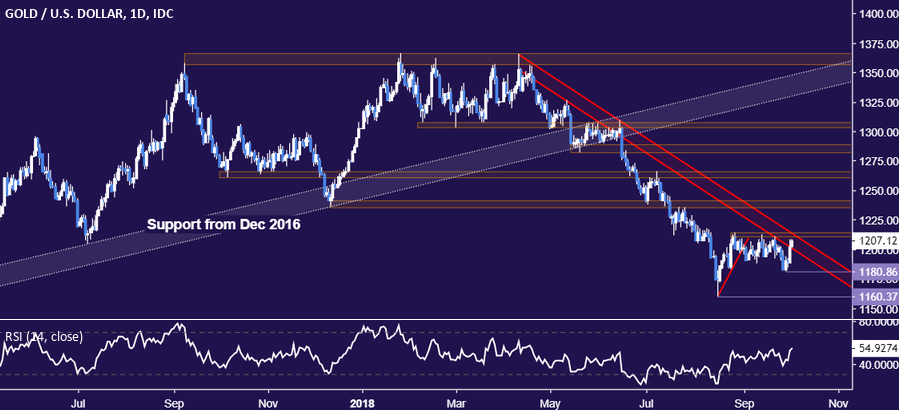
GOLD TECHNICAL ANALYSIS
Gold prices launched sharply higher to retest defining resistance in the 1211.05-14.30 area (range top, trend line from mid-April). A daily close above this barrier would neutralize the near-term bearish bias and open the door for a retest of the 1235.24-41.64 zone. Alternatively, a move below the September 28 swing low at 1180.86 exposes the mid-August bottom at 1160.37.
(Click on image to enlarge)
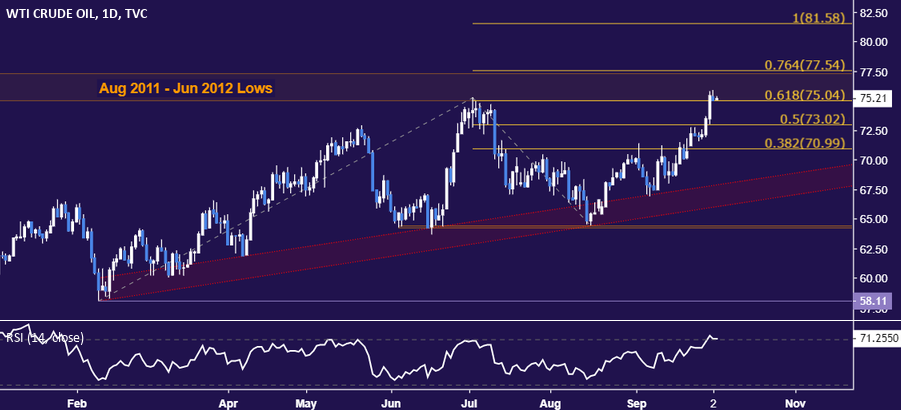
CRUDE OIL TECHNICAL ANALYSIS
Crude oil prices paused to digest gains after pushing into the 75.00-77.54 resistance area (August 2011 – June 2012 lows, 76.4% Fibonacci expansion). Breaking above the region’s upper boundary opens the door for a test of the 100% level at 81.58. Alternatively, a turn back below the 75.00 figure targets the 50% Fib at 73.02.
(Click on image to enlarge)
Disclosure: Do you want to see how retail traders are currently trading the US Dollar? Check out our IG Client Sentiment ...
more

