
Gold ETFs Getting Hotter
Gold prices are starting to climb. A funny thing happened on November 7. After hitting a low of $1,130.40 per ounce, the spot price of gold rebounded, ending the day at $1,178.70. On the previous day, November 6, spot gold closed at $1,141.30. Had gold finally “bottomed”?
Between November 7, 2012 and the closing bell on November 7, 2014, the spot price of gold had fallen 31.30 percent. The end of the Federal Reserve’s quantitative easing program was the undisputed cause of gold’s demise. After all, the quantitative easing program is credited with pushing gold prices to record highs during 2011. Because the price of gold is measured in dollars, a weaker dollar causes gold prices to climb and a stronger dollar causes gold prices to decline.
With the Federal Reserve approaching the date when it will begin raising the federal funds rate, it is difficult to understand the enthusiasm about gold. Nevertheless, since the market close on November 7, the spot price of gold rose 4.15 percent (as of December 11, 2012. Do the goldbugs now believe that “the bottom is in” for the yellow metal and now is the time to grab it at a good price?
Attached below is a Japanese Renko-type chart for the spot price of gold, during the past two years on the Chicago Mercantile Exchange. The Renko charting system uses “bricks” rather than candles, to eliminate the day-to-day “noise” and depict whatever trends have been established.
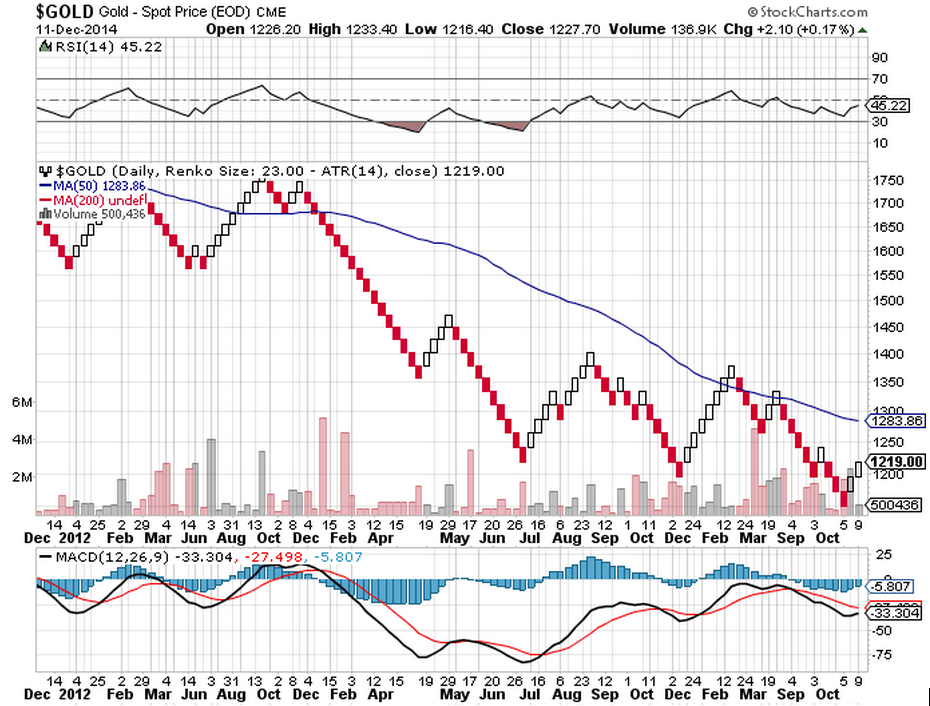
The Renko chart shows us that gold has established some degree of upward momentum. From this chart, we see the next level of overhead resistance at the high of $1,242 for the October 20 brick. (Gold actually reached a high of $1249.30 per ounce at the CME on October 20). Once it breaks out above that level, the next target would be the 50-day moving average of $1,283.86 (which is higher than the 50-day line on a candlestick chart, which was at $1,203.35). Things could get pretty exciting at that point.
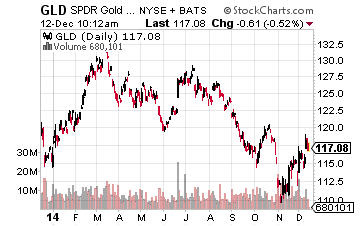
The most-popular gold ETFs are the SPDR Gold Trust ETF (GLD) and the iShares Gold Trust (IAU). Both ETFs hold gold bullion which they buy and sell as fund inflows and outflows necessitate. For example, the GLD ETF currently holds approximately 9 percent less physical gold than it held at this time last year due to the significant outflows since October, the month when quantitative easing ended. Shares for GLD are priced to represent one-tenth of an ounce of gold, less expenses.
At its December 11 closing price of $117.69 per share, GLD was 1.75 percent above its 50-day moving average of $115.66 and 3.70 percent below its 200-day moving average of $122.22. If GLD can make the 3.70 percent move and break above the 200-day line, we could see some heavy buying here.
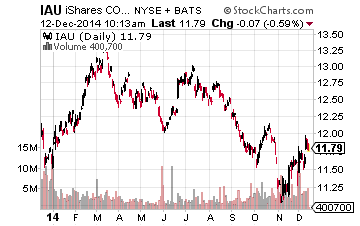
Similarly, when IAU closed at $11.86 per share on December 11, it was 1.80 percent above its 50-day moving average of $11.65 and 3.57 percent below its 200-day moving average of $12.30. In case you haven’t noticed, IAU tracks approximately one percent of the price of gold, less expenses.
Over the near term, the next big event for gold prices will be the release of the FOMC Statement on Wednesday, December 17, when the Federal Reserve’s Federal Open Market Committee concludes its December monetary policy meeting. At that point, we might get a hint about when the Fed will begin raising the federal funds rate and what the future for gold might be.
Disclosure: None.


