
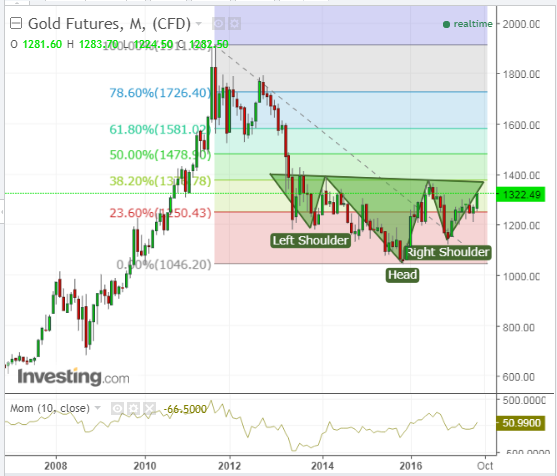
Gold Approaching Neckline Of Reverse Head & Shoulders
It looks like a a massive reverse Head & Shoulders formation could play out nicely if Gold can break and hold above its neckline (and converging 40% Fibonacci retracement level) around 1376, as shown on the Monthly chart below.
Longer term, we could see an eventual run up to converging major price and 60% Fib retracement resistance around 1600. Watch for, not only a continuing rise on the Momentum indicator, but also an increase in its velocity, should we see such a sustained neckline breakout, as confirmation of bullish commitment.
Disclaimer: All the information contained within my posts are my opinions only and none of it may be construed as financial or trading advice... please read my full Disclaimer more


