
Gold & FTSE 100 Daily Outlook – Monday, Feb. 6
Gold runs into trend line resistance
Daily chart
(Click on image to enlarge)
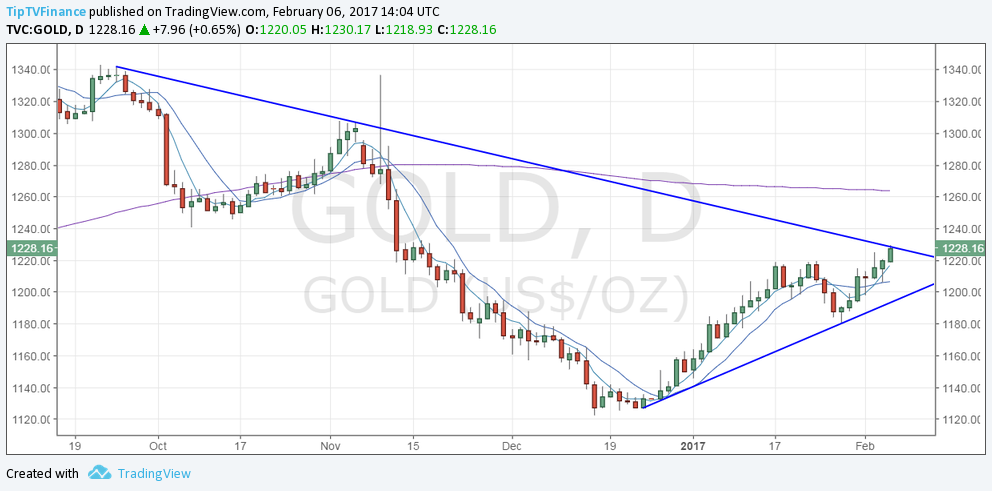
- Gold’s rebound from 10-DMA on Friday followed by a sharp rise above $1220 levels today has established a rising bottom and rising top formation.
- However, caution is still advised as the prices are chipping away at the descending trend line resistance.
- A daily close above the trend line would open doors for $1265 (200-DMA levels).
- Failure to take out/hold above the trend line hurdle followed by a break below $1220 would signal a temporary top has been made. The metal could revisit $1200 levels.
Weak treasury yields support bullish move in gold
Gold bulls could also keep stop on the 10-year treasury yield above 2.5%. The yield topped on December 15th and since then has had a tough time holding above 2.5%. The repeated failure has pushed the yield down by 7 basis points today.
Hence, gold bulls have little reason to worry. Multiple daily close in the 10-year treasury yield above 2.5% would be an early indicator of the bullish exhaustion in gold.
FTSE 100 - Rejection at 7200 is bad news
Daily chart
(Click on image to enlarge)
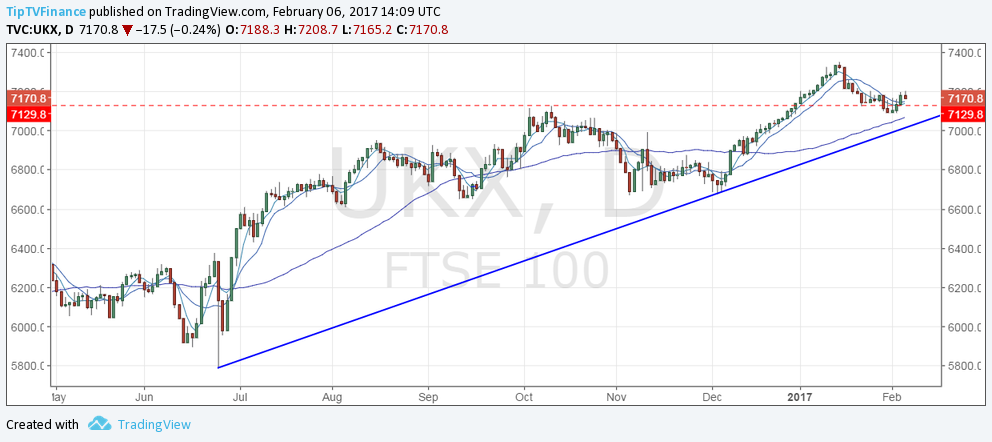
- Failure to hold above 7200 if followed by a daily close below 10-DMA would open doors for a cut through 50-DMA and drop to the rising trend line support seen currently around 7017 levels.
- On the higher side, a daily close above 7200 would signal a fresh rally to 7300-7354 (record highs).
How did you like this article? Let us know so we can better customize your reading experience.

Comments
Leave a comment to automatically be entered into
our contest to win a free Echo Show.

