
GBP/USD Extends Bullish Sequence, RSI Threatens Trendline Resistance
GBP/USD remains bid amid indications of an imminent Brexit deal, and the exchange rate may stage a large rebound ahead of the Federal Reserve meeting as it extends the series of higher highs & lows from the previous week.
GBP/USD EXTENDS BULLISH SEQUENCE, RSI THREATENS TRENDLINE RESISTANCE

The limited reaction to the Bank of England (BoE) meeting suggests the Brexit negotiations will continue to sway GBP/USD over the near-term as the central bank warns ‘the economic outlook will depend significantly on the nature of EU withdrawal,’ and it seems as though the central bank is in no rush to implement higher borrowing costs as ‘the contribution of external cost pressures, which has accounted for above-target inflation since the beginning of 2017, is projected to ease over the forecast period.’
Keep in mind, the BoE may continue to deliver two rate-hikes per year as ‘an ongoing tightening of monetary policy over the forecast period would be appropriate to return inflation sustainably to the 2% target,’ and signs of a smooth Brexit transition may fuel the rebound in GBP/USD as it puts pressure on Governor Mark Carney & Co. to start winding down the balance sheet.
At the same time, the Federal Reserve interest rate decision on November 8 may do little to sway the near-term outlook for GBP/USD as Chairman Jerome Powell & Co. are expected to retain the current policy, but the recent pickup in volatility have triggered a sharp shift in retail interest, with sentiment still holding near extremes.
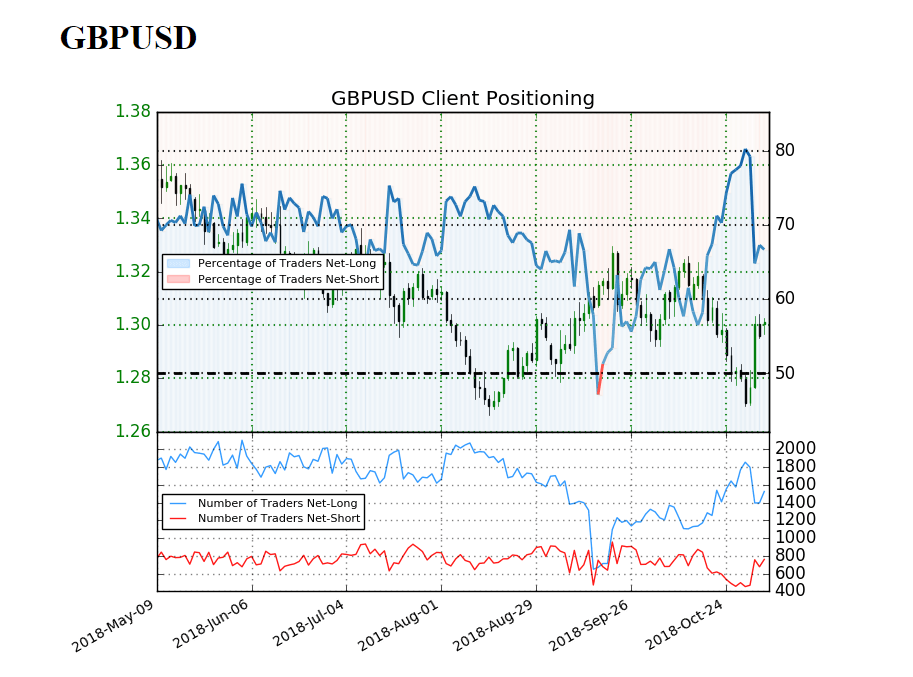
The IG Client Sentiment Report shows 66.7% of traders are still net-long GBP/USD, with the ratio of traders long to short at 2.01 to 1. In fact, traders have remained net-long since September 20 when GBP/USD traded near 1.3150 even though price as has moved 0.8% lower since then. The number of traders net-long is 12.1% higher than yesterday and 5.9% lower from last week, while the number of traders net-short is 3.3% lower than yesterday and 57.0% higher from last week.
The development in the sentiment index suggests GBP/USD will continue to squeeze higher as sentiment appears to have peaked, with the Relative Strength Index (RSI) at risk of flashing a bullish signal as it appears to be threatening trendline resistance. Nevertheless, the ongoing skew in retail position offers a contrarian view to crowd sentiment especially as the exchange rate appears to be stuck in the broad range from the August to September period.
GBP/USD DAILY CHART
(Click on image to enlarge)
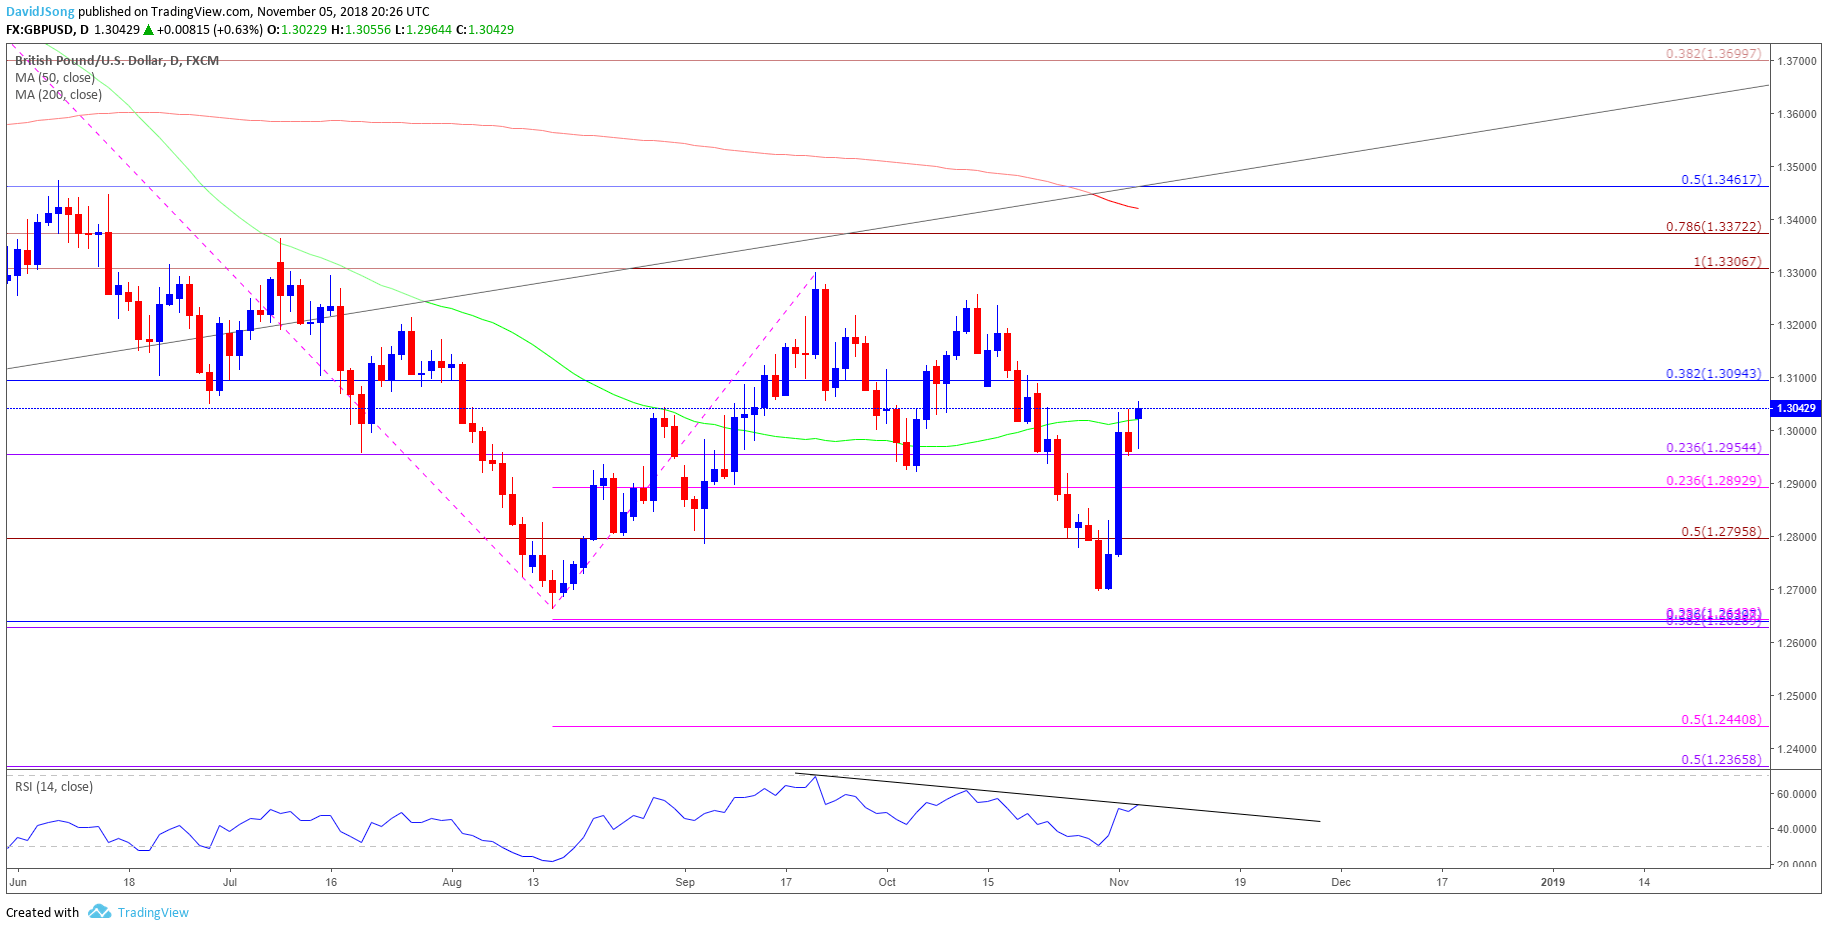
- GBP/USD stands at risk for a larger recovery following the failed run at the 2018-low (1.2662), with the RSI highlighting a similar dynamic as it flops ahead of oversold territory and threatens the bearish formation carried over from the previous month.
- In turn, a break/close above the 1.3090 (38.2% retracement) region opens up the September-high (1.3299) followed by the Fibonacci overlap around 1.3310 (100% expansion) to 1.3370 (78.6% expansion), which largely lines up with the July-high (1.3363).
Disclosure: Do you want to see how retail traders are currently trading the US Dollar? Check out our IG Client Sentiment ...
more

