
Forecasting Interest Rates
There was lots of action in financial markets last week, with much of the attention focused on the U.S. Federal Reserve. The interest rate on a 10-year U.S. Treasury bond edged up 10 basis points early in the week in anticipation that the Fed might finally raise its target for the short-term interest rate. But it shed all that and more after the Fed announced it was standing pat for now.
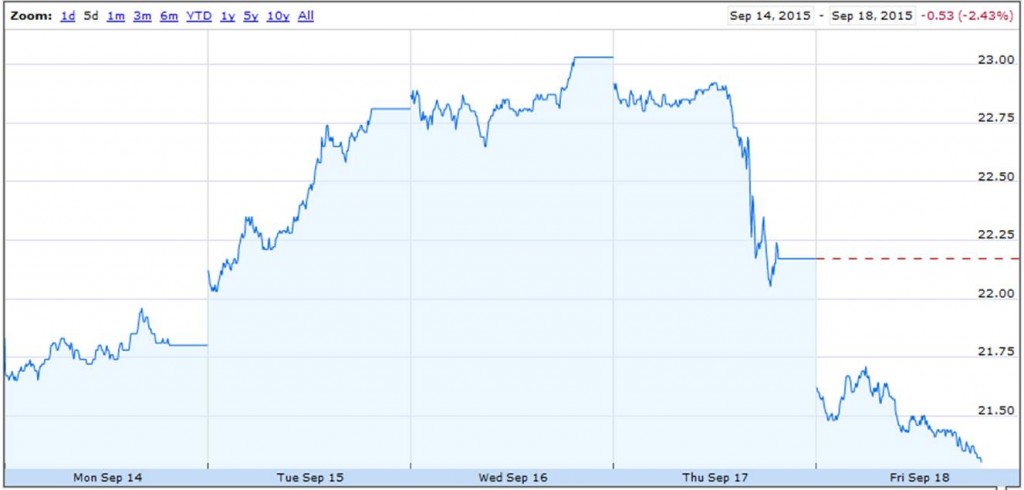
Price of CBOE option based on 10-year U.S. Treasury yield; to convert to the Treasury yield itself divide by 10. Source: Google Finance.
If bond investors were rational and unconcerned with risk, the 10-year rate should correspond to a rational expectation of what the average short-term rate is going to be over the next decade, a conjecture known as the expectations hypothesis of the term structure of interest rates. If instead the 10-year rate was above the average of expected future short rates, you’d expect a higher return from the long-term bond than staying short. If you were risk neutral, you’d prefer to go long in such a setting. But if more investors tried to do that, it would drive the long yield down and the short yield up.
If the expectations hypothesis held true, it’s hard to see how swings of the magnitude observed this week could be driven by news about the Fed. Although the Fed did not raise the overnight rate this time, it probably will by the end of this year or early next. A difference of 50 basis points for 1/4 of a year amounts to a difference of (1/40)(50) = 1.25 basis points in a 10-year average, only a tenth the size of the observed movement. Maybe people see the Fed’s decision as signaling a change in the interest rate that it will set over a much longer period, not just 2015:Q4. Or perhaps the nature of this week’s news altered investors’ tolerance for risk. To the extent that the answer is the latter, can we describe empirically the forces that seem to be driving the changes in risk tolerance and quantify the magnitude of the changes over time?
The nice thing about questions like these (unlike many of the other thorny unsettled issues in economics) is that in principle they could be resolved by an objective analysis of the data. All we need is to calculate the rational forecast of future interest rates, and compare those forecasts with the observed changes in long versus short yields.
The first step in this process is to determine the variables that should go into these forecasts. Finding the answer to this question is the topic of a paper that I’ve recently finished with Michael Bauer. Michael is an economist at the Federal Reserve Bank of San Francisco, though I should emphasize that the views expressed in the paper are purely the personal conclusions of Michael and me and do not necessarily represent those of others in the Federal Reserve System. Our paper confirms the finding from a large earlier literature that the expectations hypothesis cannot fit the data, adding lots of new evidence of predictable changes in long rates that cannot be accounted for by a rational expectation of future short rates. But we disagree with the conclusion from a number of recent studies that claim that all kinds of variables may be helpful for predicting interest rates.
We investigate instead a less restrictive model than the expectations hypothesis, which we refer to as the “spanning hypothesis,” that posits that whatever beliefs or risks bond prices may be responding to, these are priced in a consistent way across different bonds with the result that you only need to look at a few summary measures from the yield curve itself to form a rational forecast of any interest rate at any horizon. We calculate these summary measures from the first three principal components of the current set of yields on all the different maturities. Though the principal components are calculated mechanically, they have a simple intuitive interpretation. The first is basically an average of the current interest rate on bonds of all the different maturities (referred to as the “level” of interest rates), the second measures the difference between the yield on long-term bonds and short-term bonds (a.k.a. the “slope” of the yield curve), and the third reflects how much steeper the yield curve is at the short end relative to the long end (the “curvature” of the yield curve).
The main contribution of our paper is to show why other researchers were misled into thinking variables besides these three factors might help predict interest rates. It’s long been known that one has to be careful using regression t-statistics to interpret the validity of predictive relations when the explanatory variables are highly persistent and correlated with lagged values of the variable you’re trying to predict, a phenomenon sometimes described as Stambaugh bias; Campbell and Yogo have a thorough investigation of this phenomenon. My new paper with Michael identifies a different setting in which a related problem can arise. Namely, if you add other extraneous highly persistent regressors to a regression for which the coefficients on the true predictors would be susceptible to Stambaugh bias, any of the usual procedures for estimating the standard errors on those extraneous variables, such as heteroskedasticity- and autocorrelation-consistent standard errors, will significantly overstate how precisely you have estimated the coefficients, even if the extraneous predictors have nothing at all to do with either the true predictors or the variable you’re trying to predict. In our setting, the variable we’re trying to predict is the excess return on a particular bond, and what we claim are the true predictors are the level and slope of the yield curve (both highly persistent and correlated with lagged values of excess returns). That means when you add another variable to the regression that’s highly persistent such as inflation or measures of GDP, you’ll think you have something statistically significant when it fact it is of no use at all in predicting interest rates.
In addition to working out the econometric theory for how this happens, we develop an easy-to-implement bootstrap representation of the data in which the only variables that can predict interest rates or bond returns are the level, slope, and curvature, and investigate what would happen in such a setting if you performed the kinds of analyses conducted by earlier researchers. We find that a researcher could easily mistakenly think he or she had found a useful predictive relationship when the reality is that there is none, and show point by point how the findings of previous studies are completely in line with the claim that only three variables are of any use for predicting interest rates. We also find that an ingenious test proposed by Ibragimov and Mueller can sometimes work very well to detect the problems in this setting. Basically their test tries to estimate the standard error of coefficients by seeing how much they differ when estimated across different samples. Here again one finds a warning flag in the earlier studies– the apparent predictability of interest rates seems very strong for a short time, but then falls apart on other data.
Our study also updates many of the models estimated by previous researchers, and finds that none of these proposed forecasting relations has held up very well in the data that came in after the original study was first published. By contrast, the predictive power of the level and slope hold up quite well in any subsample we looked at, confirming the solid rejection of the expectations hypothesis in the earlier literature.
The bottom line: bond returns and departures from the expectations hypothesis are predictable. And it’s easier to do than some studies have been suggesting.
Here’s the summary from the paper:
A consensus has recently emerged that a number of variables in addition to the level, slope, and curvature of the term structure can help predict interest rates and excess bond returns. We demonstrate that the statistical tests that have been used to support this conclusion are subject to very large size distortions from a previously unrecognized problem arising from highly persistent regressors and correlation between the true predictors and lags of the dependent variable. We revisit the evidence using tests that are robust to this problem and conclude that the current consensus is wrong. Only the level and the slope of the yield curve are robust predictors of excess bond returns, and there is no robust and convincing evidence for unspanned macro risk.


