
Fed Playing Didgeridoo With U.S. Monetary Base

The didgeridoo is an Australian Aboriginal wind instrument played using a technique called "circular breathing" whereby blowing produces a continuous drone whilst quick snatches of air are inhaled through the nose. A sort of simultaneous sucking and blowing.
Following an unprecedented explosion in the U.S. monetary base post Lehman an equally unprecedented contraction is underway. Sucking.
However, the net Actual Working Monetary Base (AWMB) is still expanding as excess reserves held at the Fed are falling at an even faster pace than the total monetary base is contracting. Blowing.
The slow pace of the economic recovery has been much more in line with the growth of the AWMB than the total monetary base.
Continued AWMB expansion should mean continuing US economic growth.
Contraction of the total monetary base points to a stronger U.S. dollar weaker gold and commodity prices and a lower for longer interest rates along with a delay in any rise in the Fed Funds rate until 2017 at the earliest.
With the total monetary base falling, gold is a conundrum but it should recover to the US$1,600 per ounce next year.
Equities still priced at a 50% discount to dividend discount value and very much worth buying
Sucking - Total U.S. Monetary Base Falling.
Since peaking in August 2014 at US$4.1 trillion, the U.S. monetary base has declined by US$0.42 trillion or 10% to US$3.7 trillion. While this contraction may seem small, it is the first time that the monetary base has fallen by such percentage. In absolute terms the seemingly moderate percentage reduction from its peak equals 50% of the US$0.84 trillion monetary base in August 2008 just prior to the Lehman crisis.
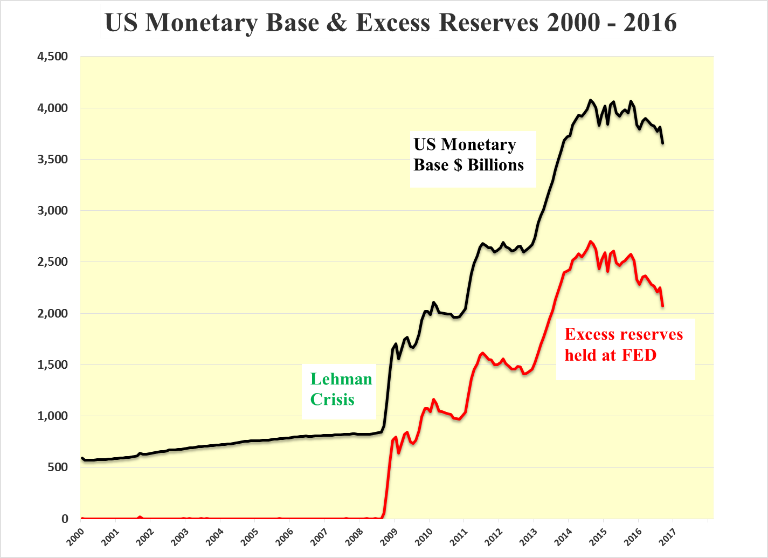
Blowing - Excess Reserves Falling Faster than Total Monetary Base
Excess reserves have come down an even greater US$0.6 trillion or 23% from a peak of US$2.7 trillion to US$2.1 trillion. This shows that the commercial banks are finally being more aggressive in pushing the money created by the Fed through QE out into the real economy.
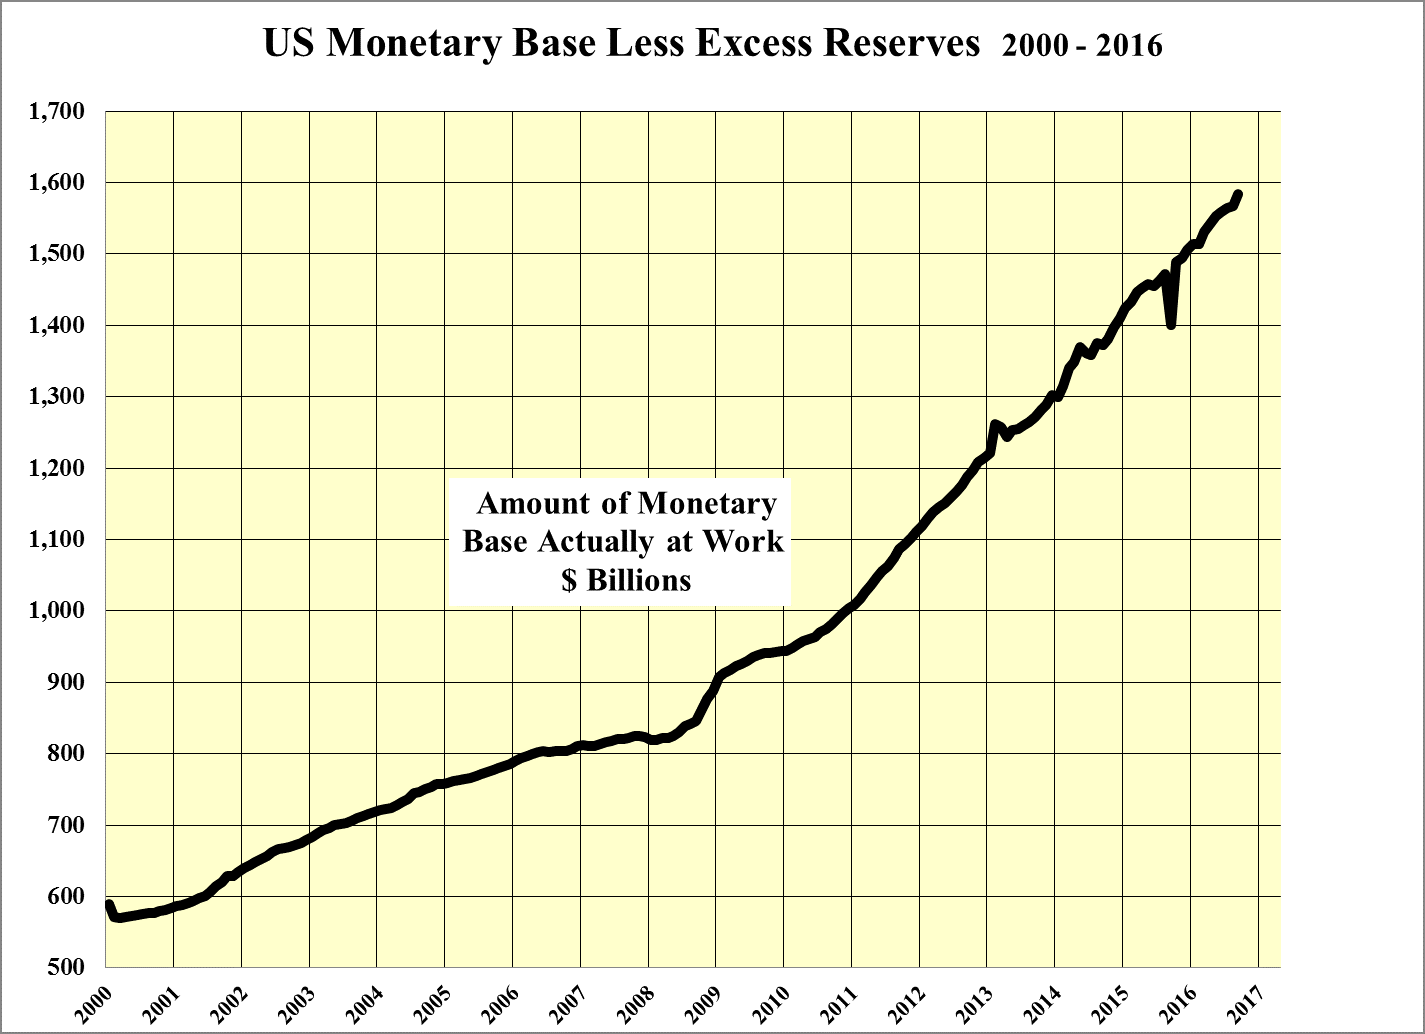
Subtracting the excess reserves from the total monetary base shows how much of the QE stimulus has passed through to the real economy. Denoted in the following chart as the Actual Working Monetary Base (AWMB):
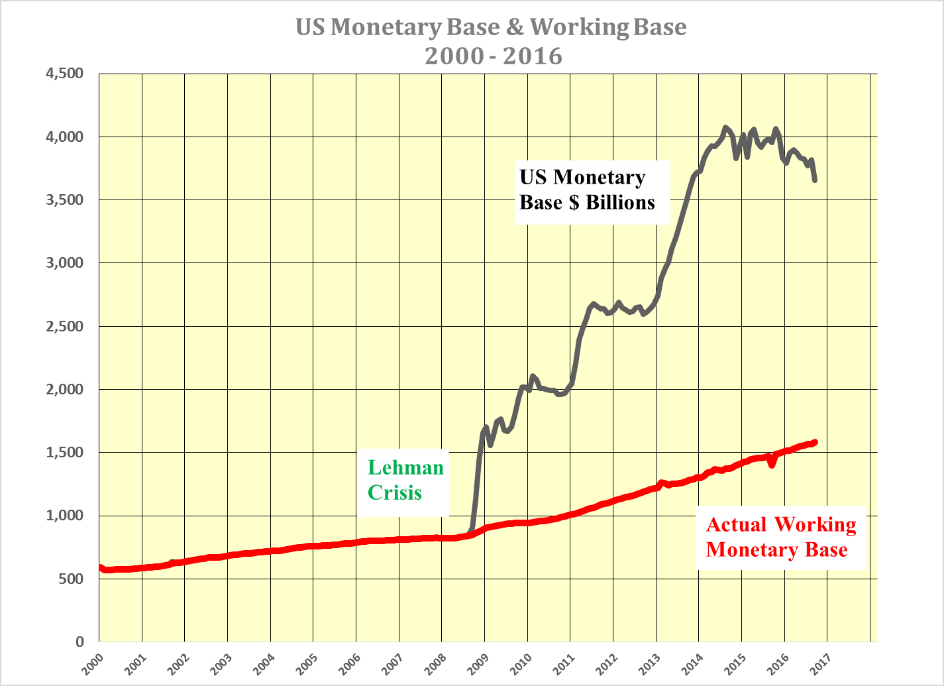
From August 2008 to the end of September 2016 the AWMB has risen by 88% from US$0.842 trillion to US$1.584 trillion significantly less than the 333% increase in the total reported monetary base from US$0.844 trillion to US$3.657 trillion today.
The lagging GDP performance compared to the total rise in the US Monetary base can be attributed to the failure of the commercial banks to push the money out into the real economy. Whether this is the result of fear, the changes in bank regulations or ultra-conservatism it is not known. However, the result of holding unprecedented amounts of reserves at the Fed has stymied the rate and magnitude of GDP recovery that might otherwise have been the case had the entire monetary base been allowed to pass through to the real economy.
Quantitative Contraction Underway but not AWMB
The 10% decline in the total monetary base is quantitative contraction. Considerable tightening by the Fed, with all the ramifications of a pending recession. However, such an interpretation would be misguided as the GDP has seemingly responded only to the AWMB.
Much room for AWMB to expand as total base contracts – Didgeridoo to play on.
With the recent increase in state and local bond issues for infrastructure spending along with promises from both federal election candidates of more infrastructure spending to come, it would seem that the AWMB is set to continue to rise for a good few years yet. With the excess reserves held at the Fed standing at US$2.1 trillion there is certainly a great deal of room for both the total monetary base of US$ 3.7 trillion to decline and the AWMB of US$1.6 trillion to rise.
This in turn should provide fuel for the US GDP to continue to expand at a pace in concert with the growth in the AWMB. Simultaneously, the contraction of the total monetary base should hold inflation in check.
Likely Outcome - Strong U.S. Dollar and Lower for Longer Rates
Unfortunately, quantitative contraction in the United States happening while QE is taking place elsewhere suggests strongly that the US dollar should strengthen relative to other currencies. While this would be negative for commodities priced in US dollars it should mean that the US bond market will attract yield seeking international investors and momentum-following, domestic-market participants. In short the US bond bull looks as though it has further to run.
- As well as strong equity markets which still trade below 50% of value
In turn this should fuel further advances in the equity markets. Particularly as there is little prospect of a recession and earnings should rebound as we exit 2016. With the caveat that too strong a US dollar will impact negatively multinational US corporations and commodity producers. U.S. dollar strength could result in the Fed holding off raising the Funds rate until 2017 or beyond.
Gold is a Conundrum
Gold has stood the test of time as a store of value in times of war, pestilence, political upheaval and inflation. On the inflationary front since 1950 and in the period leading up to and after the closing of “gold window” by President Nixon the price of gold has risen in concert with the general rise in the monetary base.
Post Lehman when the U.S. monetary base exploded on the upside with TARP and the subsequent QE, it made a great deal of sense to expect the gold price to track the monetary base into the stratosphere. This together with massive short covering culminated in the bullion price exceeding US$1,900 per ounce in 2011. Thereafter, its subsequent decline was puzzling as QE continued for another three years.
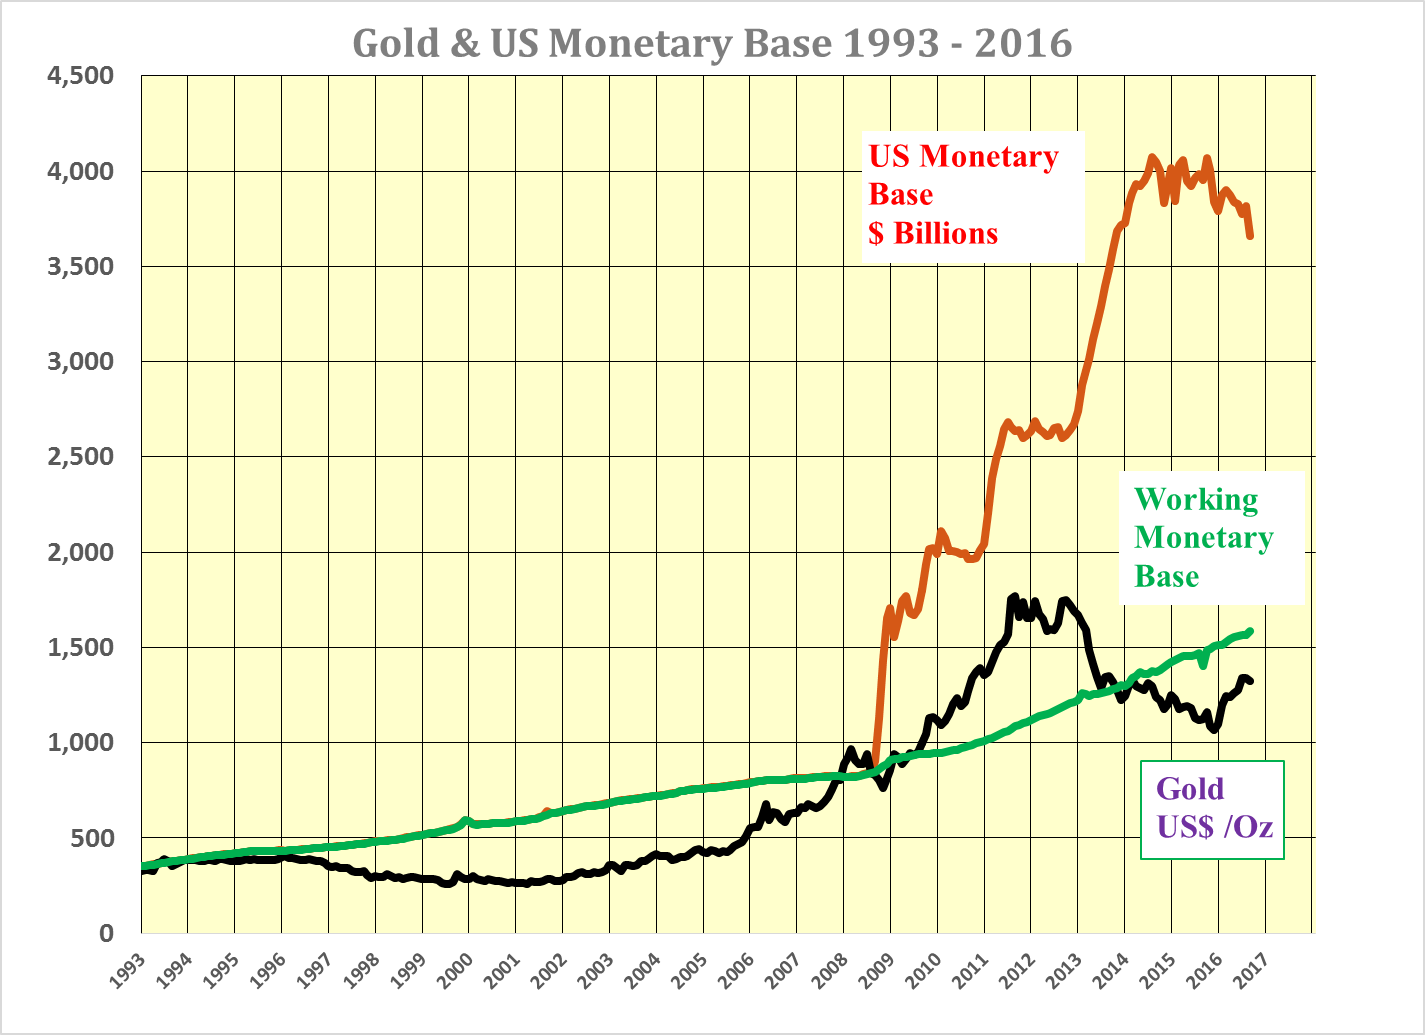
It was only after recognising that much of QE had been sterilized by the huge buildup of excess reserves at the Fed that it made sense for the price of gold to have reverted to the path of the AWMD. It was the recognition of this change that lead the tempering of my enthusiasm for a runaway gold price. Last year I projected a recovery in the gold price to the US$1,400 level, which has been achieved on a daily basis
Following the same argument the price of gold should move toward US$1,600 per ounce all other things being equal. However, as the total monetary base is now falling and the U.S. dollar is strengthening it seems certain that there will be weakness in the gold price in the short term until it is recognised that the AWMB is the important vector to watch and this should continue to rise. At this stage I expect the gold price to reach US$1,600 per ounce sometime in 2017.
more


