
EUR/USD Holds Resistance On No-Change ECB: Focus Moves To Inflation
EUR/USD HOLDS AT RESISTANCE AS ECB MAKES NO MATERIAL CHANGES TO POLICY, STATEMENT
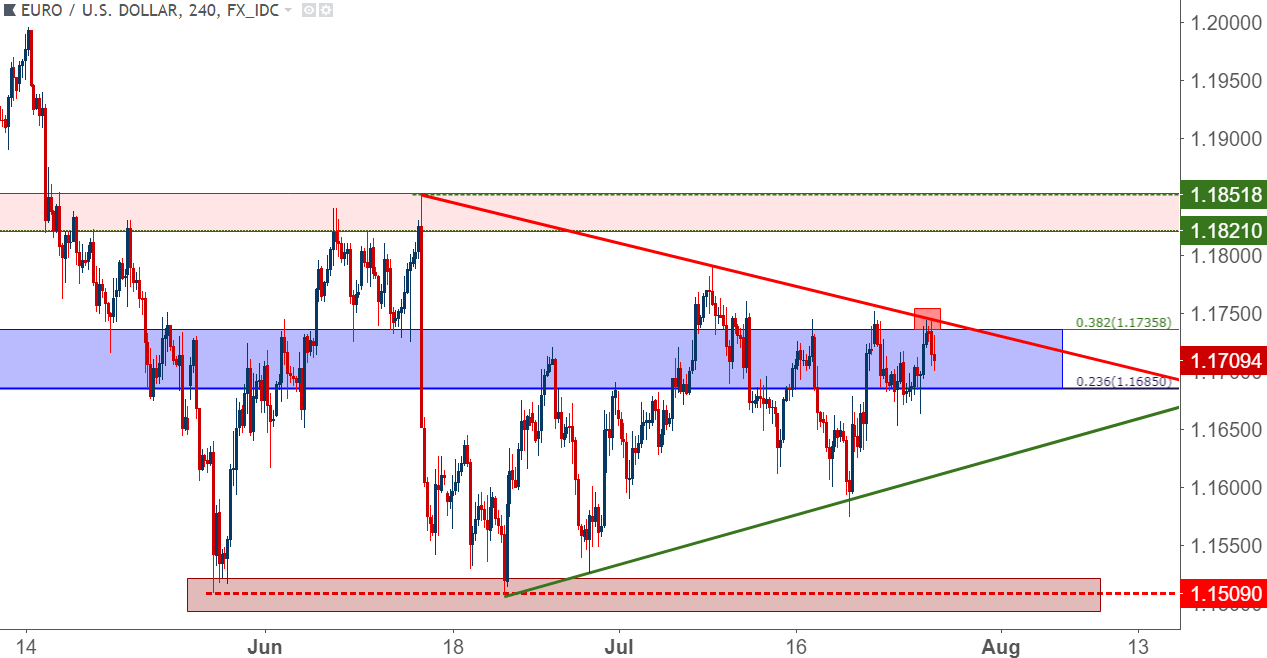
This morning’s ECB rate decision has been without significant fanfare. The bank reiterated their stance that they’re anticipating keeping rates at current levels ‘at least through summer of 2019,’ while also confirming their earlier strategy to taper bond purchases by the end of the year, beginning in September. This brought upon a minor move in EUR/USD as the currency remains in the symmetrical wedge pattern that’s been building for the entirety of Q3.
EUR/USD FOUR-HOUR PRICE CHART: HOLDS RESISTANCE, POSES MINOR MOVE ON NO-CHANGE ECB
(Click on image to enlarge)
EURO-ZONE INFLATION TO BE RELEASED ON TUESDAY
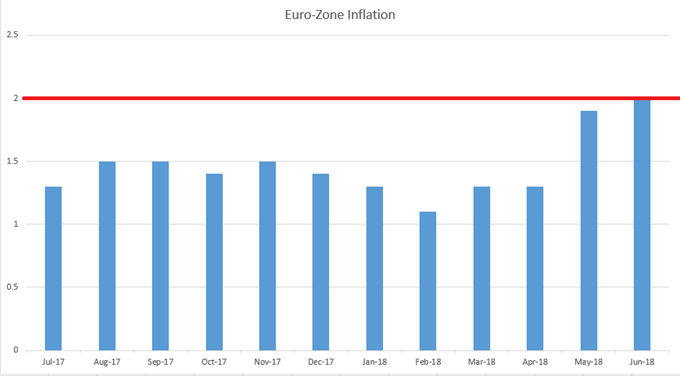
Shortly after the ECB’s rate decision in June, Euro-Zone inflation for the month of June was released at a 2% print – right at the ECB’s target for inflation. This was an improvement on the prior month’s jump up to 1.9%, and this is starting to show a trend with European inflation. This topside trend to European inflation started to drive the thought that the ECB may have to hike ahead of the previous Q4, 2019 estimation, and there was the slight chance that the bank may acknowledge as such at this morning’s rate decision.
That did not happen, as the ECB made minimal changes to last month’s statement, and this puts focus squarely on next week’s Euro-Zone inflation numbers. This makes next week’s data outlay even more interesting, as we also have rate decisions from the Bank of Japan, the Federal Reserve and the Bank of England.
EURO-ZONE INFLATION HIGHLIGHTS OF NEXT WEEK’S EUROPEAN ECONOMIC CALENDAR
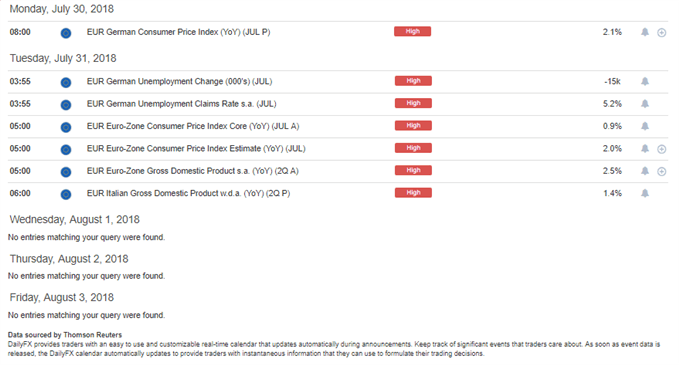
Chart prepared by James Stanley
Regarding inflation, we go into next week’s CPI numbers after a boost from the prior two months. If we do see continued strength here, this could bring back bullish price action in the single currency, much like we saw for the bulk of 2017 trade. The ECB remained dovish and passive throughout last year, but that didn’t stop markets and investors from pushing the Euro higher in anticipation of a hawkish shift at the Central Bank.
EURO-ZONE HEADLINE INFLATION AT THE ECB’S 2% TARGET IN JUNE: WILL JULY CONTINUE THE TREND?
LONGER-TERM EUR/USD
That wedge that’s been building in EUR/USD over the past couple of months comes after an aggressive bearish move that showed in Q2. That bearish move was driven by a combination of factors: It got started around the April ECB rate decision, and caught an aggressive gust of selling in May as European politics became a headline risk once again. The pair established a bottom in the waning days of May at 1.1509, and this is the time that rumors began to circulate that the ECB would announce options around stimulus-taper at their upcoming rate decision in June.
The prevailing thought there was that stimulus-taper would soon lead to higher rates; but when we got to the actual announcement, the ECB effectively divorced the themes of stimulus-taper and higher rates by saying that, while they’re planning on tapering stimulus in 2018, they’re also not planning on adjusting rates for at least 15 months. This functioned as a bearish driver for the currency, and EUR/USD made a fast move right back down to that 1.1509 low. But – just as we saw in May, sellers dried up and prices started to bounce as the pair was unable to encroach upon the 1.1500 psychological level.
Since then, it’s been higher-lows coupled with lower-highs as the pair has traded deeper into the symmetrical wedge/triangle pattern that’s been building for the entirety of Q3.
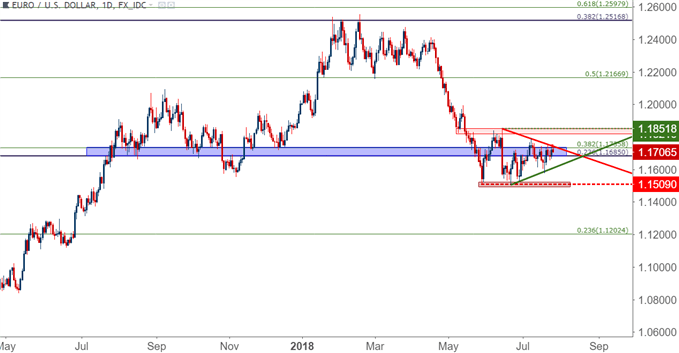
EUR/USD DAILY PRICE CHART: Q2 DOWN-TREND FINDS SUPPORT, DIGESTS MOVE AS MARKETS AWAIT NEXT DRIVER
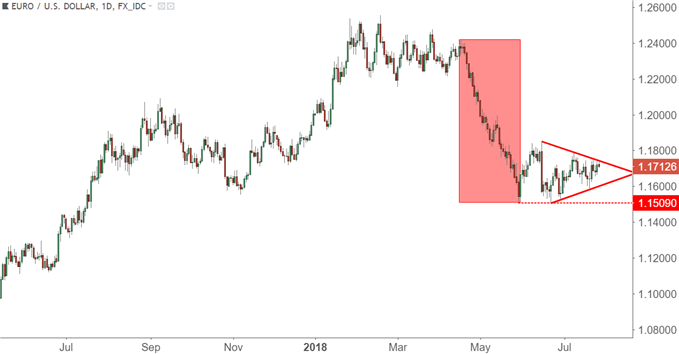
At this stage, traders looking at longer-term or position-based stances will likely want to wait for resolution of the past month’s chop before looking to pick a side. Support is fairly well-defined around 1.1509, while resistance from the June swing-high around 1.1852 could be looked at as longer-term resistance. A breach through either of those levels can open the door to trend-based continuation strategies as we move deeper into the second-half of the year.
EUR/USD DAILY PRICE CHART: RESOLUTION OF DIGESTION TO OPEN DOOR TO LONGER-TERM TREND STRATEGIES
Disclosure: Do you want to see how retail traders are currently trading the US Dollar? Check out our IG Client Sentiment ...
more

