
EUR/USD Begins Test Of Key Resistance, USD Bounces From Monthly Lows
NEXT WEEK’S CALENDAR CALMS, BUT WILL EURO BULLS, DOLLAR BEARS SHOW THEIR HAND?
This week’s economic calendar was rather heavy, particularly Thursday, and this leaves FX markets in a state of limbo as we lead into a quieter calendar for next week. The big question surrounding FX markets at the moment concern two of the world’s most popular currencies, as both the Euro and the US Dollar appear to be in some state of transition. While the Euro spent the bulk of 2017 and the first quarter of 2018 moving-higher, a bearish reversal developed in Q2 as a series of events surrounded the Euro-Zone and the ECB. This helped the US Dollar to finally stage some element of strength after a brutal 13-month sell-off that saw as much as 15% of the currency’s value erased.
But US Dollar bulls and Euro bears have been able to show much promise in Q3, and as we now have two weeks until the end of the quarter, the prospect of those bigger-picture 2017 trends returning appears to be a bit more likely. On the economic calendar for next week - we have Central Bank rate decisions out of both Japan and Switzerland, set to take place on Tuesday night and Thursday morning. We will see inflation prints out of both the UK and Canada (Wednesday morning and Friday morning), and we’ll even get some Central Bank commentary from ECB President Mario Draghi in a speech mid-week.
DAILYFX ECONOMIC CALENDAR: HIGH-IMPACT EVENTS FOR THE WEEK OF SEPTEMBER 17, 2018
(Click on image to enlarge)
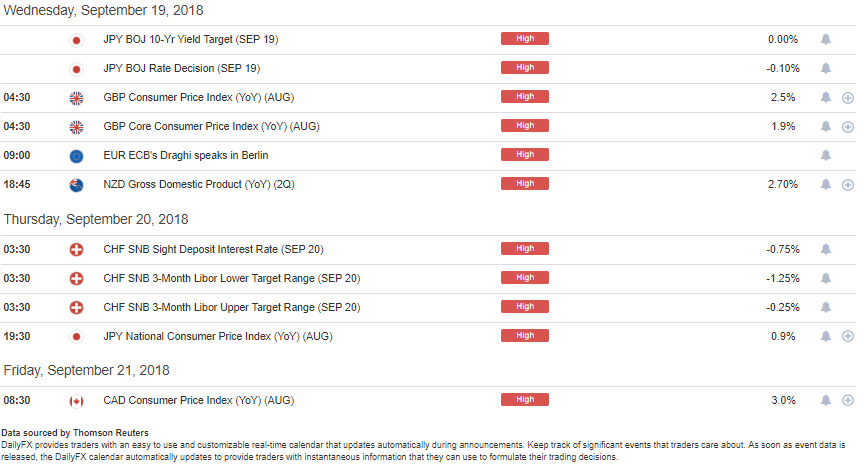
Chart prepared by James Stanley
US DOLLAR BOUNCING FROM FRESH MONTHLY LOWS
Probably one of the bigger takeaways from this week was the weakness in the US Dollar, as the currency sold-off every day Monday-Thursday until, eventually, we had set a fresh monthly low earlier this morning. The week started in a seemingly positive way, as USD quickly moved-up to test the same 95.53 level that had helped to offer resistance last week and, bigger-picture, over the past few months. This was somewhat of an extension of strength that had shown around last week’s NFP report, but that was soon reversed as USDbears took control of near-term price action.
US DOLLAR TWO-HOUR PRICE CHART: BOUNCE FROM FRESH MONTHLY LOWS AFTER SELLING-OFF MONDAY-THURSDAY
(Click on image to enlarge)
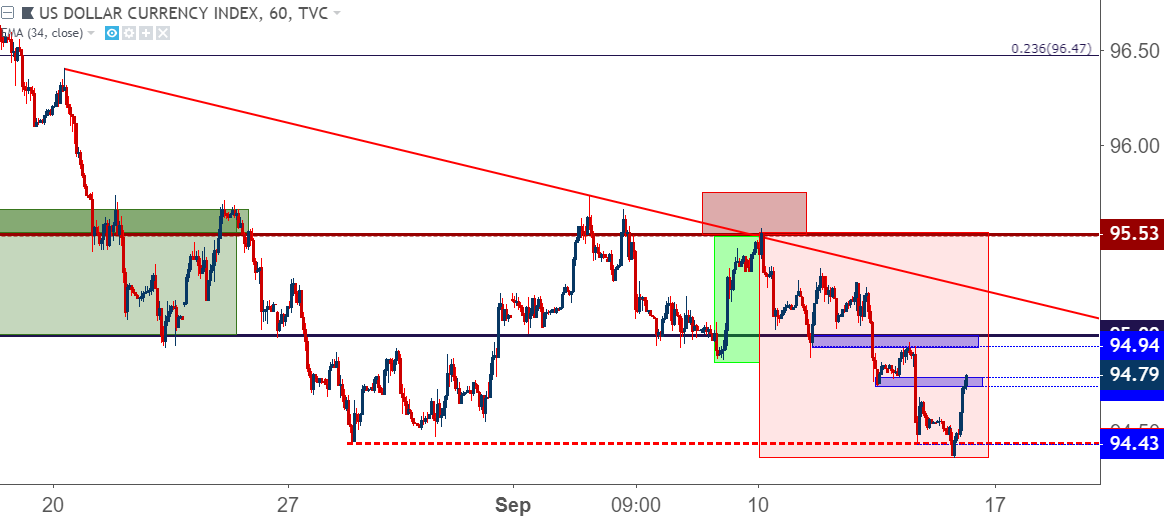
Chart prepared by James Stanley
The big question around the US Dollar for next week is whether bears will be able to make additional ground to fresh lows. Given the dearth of US drivers on the calendar, it would appear that we have ample opportunity for Dollar bears to show their hands. The US Dollar is bouncing off of those fresh monthly lows that were set earlier this morning, and if sellers show to offer lower-high resistance below prior support, the door for bearish continuation can remain open.
US DOLLAR FOUR-HOUR PRICE CHART: BOUNCE FROM MONTHLY LOWS - WILL SELLERS SHOW RESISTANCE AT PRIOR SUPPORT?
(Click on image to enlarge)
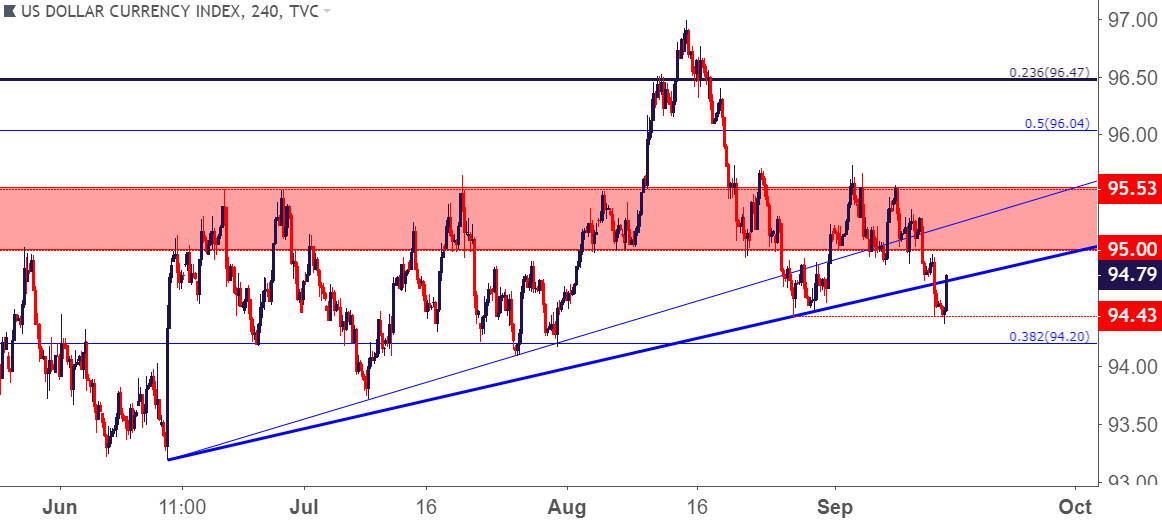
Chart prepared by James Stanley
EUR/USD BEGINS TEST OF KEY RESISTANCE
As we had a fairly visible sell-off in the US Dollar throughout this week, EUR/USD put in a strong showing as prices bounced from an early-week test at the 1.1530 support level. That bounce lasted into this morning and prices in the pair began a re-test of what’s become a big zone of resistance. We’ve been following this area over the past month, and this runs from the 38.2% retracement of last year’s up-trend to the 1.1750 psychological level.
EUR/USD FOUR-HOUR PRICE CHART: FROM EARLY-WEEK SUPPORT TEST TO KEY RESISTANCE ZONE
(Click on image to enlarge)
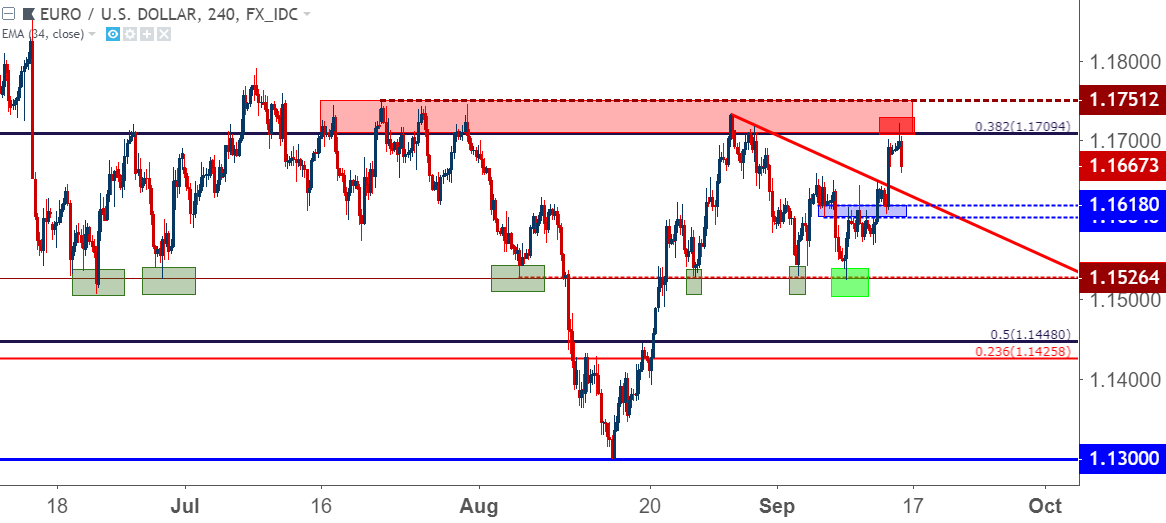
Chart prepared by James Stanley
As we’ve been following, a topside break of that zone can open the door for a return of the longer-term bullish trend in EUR/USD that started in April of last year. We looked deeper into the matter in yesterday’s webinar, sharing the fact that there are three long-term Fibonacci levels of relevance within a 50-pip range around this resistance. At 1.1685 we have the 23.6% marker of 2008-2017 sell-off, and at 1.1709 we have the 38.2% marker of the 2017 up-trend. A bit higher at 1.1735 we have the 38.2% retracement of the 2014-2017 sell-off (the ECB QE move), and a break above this big swath of potential resistance can make the idea of continued upside seem considerably more attractive.
EUR/USD EIGHT-HOUR PRICE CHART: A CONFLUENCE OF FIBONACCI RESISTANCE
(Click on image to enlarge)
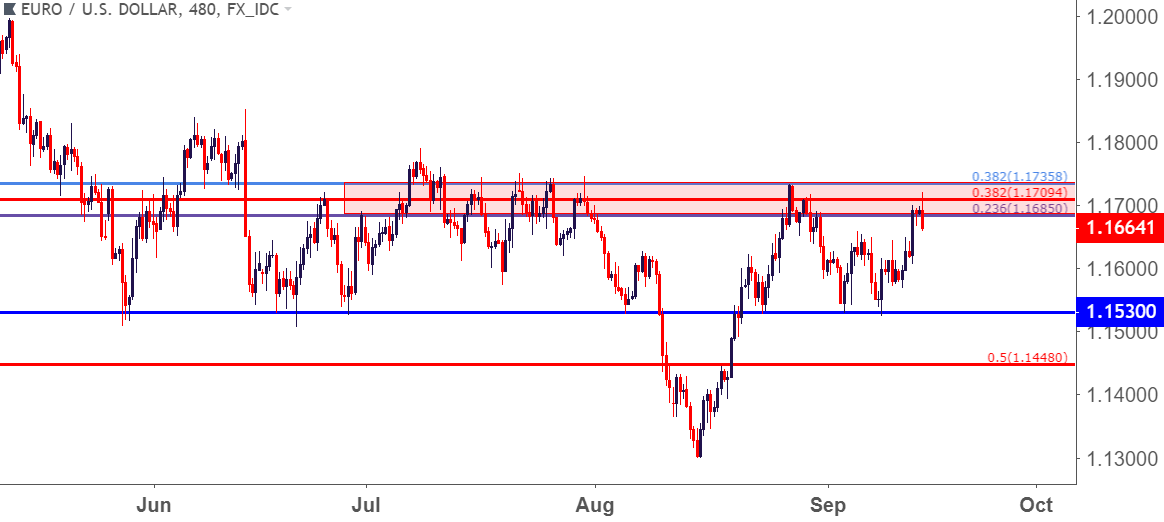
Chart prepared by James Stanley
GBP/USD: HOLDING FIBONACCI RESISTANCE AS PRICE ACTION CLEANS UP
It’s been an interesting situation around Cable of recent as we came into August in the midst of an aggressive one-sided trend. Prices sold off virtually every day in the first half of August, with support soon showing at a key Fibonacci level at 1.2671. This is the 23.6% marker of the ‘Brexit move’ in the pair, and the 78.6% marker of the same major move helped to mark resistance in the pair in mid-April, just before bears took over for the next four months.
The 38.2% marker of that same major move has come into play this week, and buyers haven’t yet been able to make much ground above this level.
GBP/USD DAILY PRICE CHART: HIGHS HOLDING AT 38.2% FIBONACCI RETRACEMENT
(Click on image to enlarge)
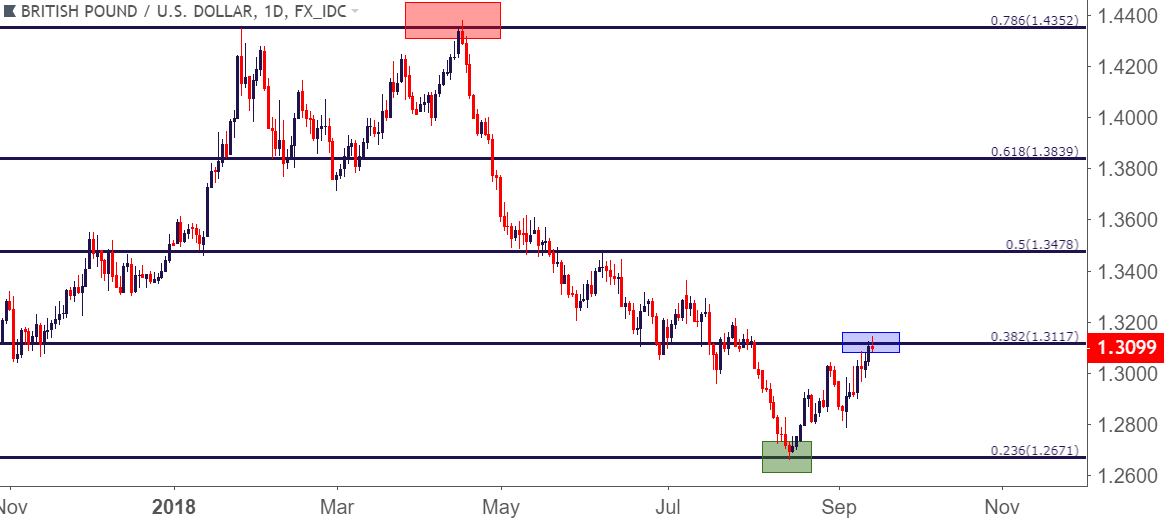
Chart prepared by James Stanley
As we looked at earlier this week, that resistance level coming into play is not necessarily a bearish factor, as this could allow for a pullback that could open the door to topside continuation strategies. Brexit headlines continue to push the price action around the British Pound, but we have seen some element of bullish defense at higher-lows that could allude to further upside.
The big item from this week was cauterization of support around the 1.3000 handle, as both Tuesday and Wednesday saw downside tests that were eventually faded-out as bulls pushed up to 1.3117. For those looking at long stances, they would likely want to see a further defense of this support, looking for higher lows above the 1.3000 psychological level.
GBP/USD TWO-HOUR PRICE CHART
(Click on image to enlarge)
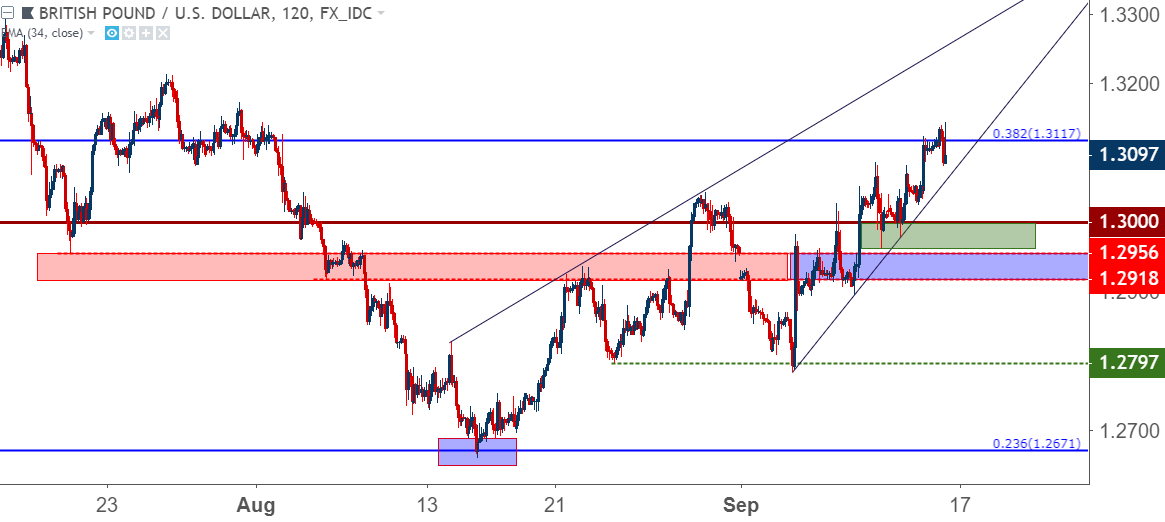
Chart prepared by James Stanley
YEN WEAKNESS RE-APPEARS, BUT CAN IT LAST THROUGH BOJ?
Next week brings the Bank of Japan in the early portion of next week, and another of the key takeaways from this week was a return of Yen weakness. USD/JPY tested up to fresh monthly highs after yesterday’s US CPI print, and this brings the potential for further gains in the pair. It’s still very early, and after the messy month of August, traders would likely want to wait for a bit of additional confirmation before looking to push bullish strategies in USD/JPY; but this observation could be helpful in other pairs such as EUR/JPY or GBP/JPY, which we’ll look at below.
USD/JPY EIGHT-HOUR PRICE CHART: FRESH MONTHLY HIGHS AS YEN-WEAKNESS OUTPACES USD SELL-OFF THIS WEEK
(Click on image to enlarge)
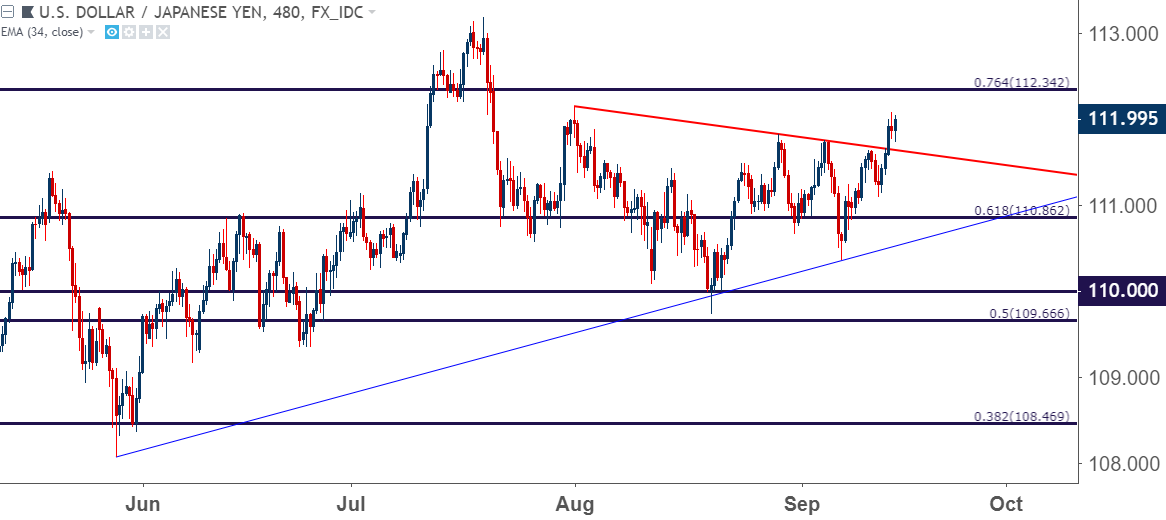
Chart prepared by James Stanley
EUR/JPY BULLISH POTENTIAL AFTER FRESH MONTHLY HIGHS
Where that Yen-weakness could be a bit more interesting is against currencies that are not the US Dollar, as it appears that the Greenback is in its own state of flux at the moment. We looked into EUR/JPY earlier in the week, remarking that the messy price action that was showing at the time left us with a non-directional setup on the charts. But – we also pointed out the resistance area around 131.00, pointing to the fact that a topside test of this level could open the door for higher-low support that could be utilized for strategies of bullish continuation.
The combination of Euro strength and Yen weakness from yesterday’s data helped to push the pair up to a fresh monthly high, and we’re seeing a bit of resistance show off of the early-August swing-high at 131.11. As we wrote earlier this week, that topside test through resistance opens the door for higher-low support in the 130-130.35 area, which could allow for stops below the confluent batch of prior Fibonacci resistance that runs from 129.47-129.66.
EUR/JPY FOUR-HOUR PRICE CHART: HIGHER-LOW SUPPORT POTENTIAL AFTER FRESH MONTHLY HIGHS
(Click on image to enlarge)
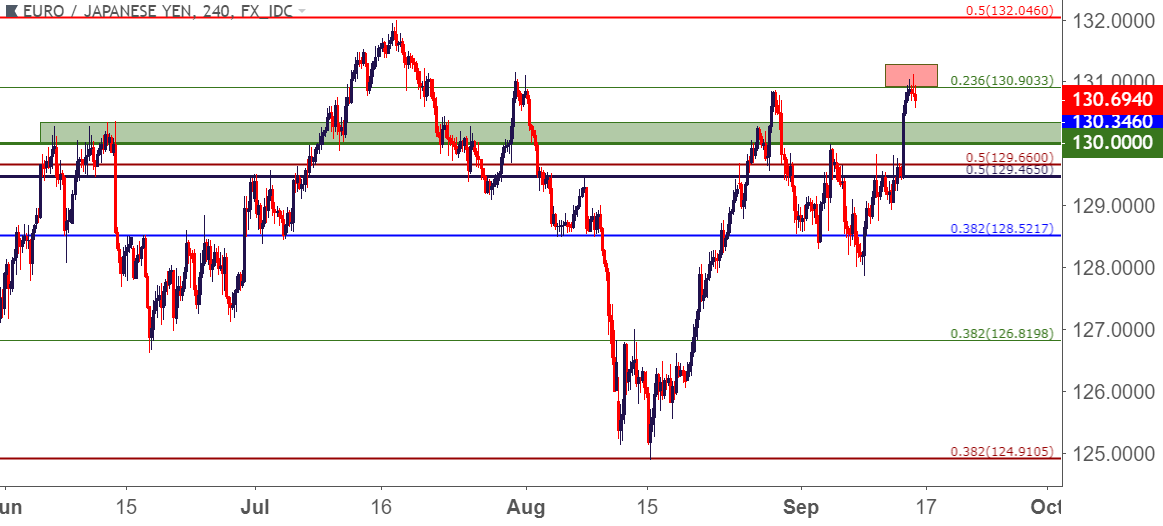
Chart prepared by James Stanley
GBP/JPY HOLDING RESISTANCE AT A BIG FIBONACCI LEVEL
The price of 147.04 has been a recurring theme in GBP/JPY over the past year, helping to produce both support and resistance in a variety of ways. This is the 38.2% retracement of the ‘Abenomics’ move in the pair, taking the 2011 low up to the 2015 high.
This price helped to set a double-bottom in GBP/JPY in October and November of last year. The level came back as quick support in March and produced another shorter-term double-bottom in the month of May. Most recently, we saw resistance form here as we turned the page into August, leading into a rather aggressive 700-pip sell-off.
GBP/JPY DAILY PRICE CHART: 147.04 IS BACK IN PLAY
(Click on image to enlarge)
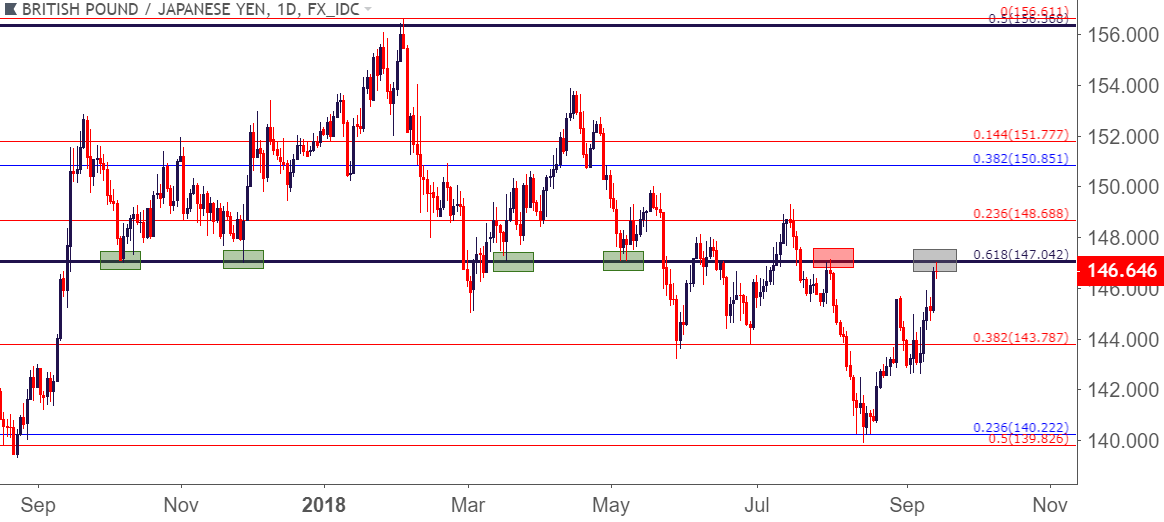
Chart prepared by James Stanley
As we discussed earlier this week in our webinar, a test at this resistance does not nullify bullish potential here, as this could be a pause point in the bullish uptrend. Below, we look at two areas of potential higher-low support that could open the door for topside strategies, looking for a re-test of that 147.04 Fibonacci level. Below, we look at two nearby zones that could be utilized for such a purpose. The key will be support actually showing before exposure is investigated, as this has been a fast-moving theme with potential for continued volatility as Brexit-headlines continue to dominate the flow in GBP-related pairs.
GBP/JPY FOUR-HOUR PRICE CHART
(Click on image to enlarge)
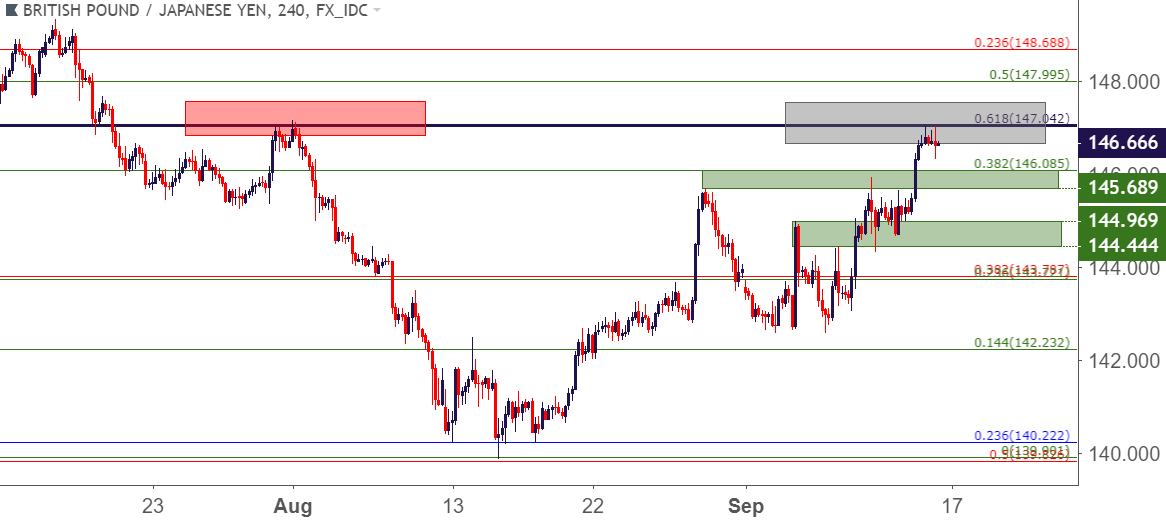
Chart prepared by James Stanley
As we discussed earlier this week in our webinar, a test at this resistance does not nullify bullish potential here, as this could be a pause point in the bullish uptrend. Below, we look at two areas of potential higher-low support that could open the door for topside strategies, looking for a re-test of that 147.04 Fibonacci level. Below, we look at two nearby zones that could be utilized for such a purpose. The key will be support actually showing before exposure is investigated, as this has been a fast-moving theme with potential for continued volatility as Brexit-headlines continue to dominate the flow in GBP-related pairs.
GBP/JPY FOUR-HOUR PRICE CHART
(Click on image to enlarge)
Chart prepared by James Stanley
Disclosure: Do you want to see how retail traders are currently trading the US Dollar? Check out our IG Client Sentiment ...
more

