
ETH/USD: A Clear Break Above $230 Is Critical For Ethereum Bulls
Ethereum managed to shrug off a leadership challenge by Ripple as the top Altcoin. However, the ETH/USD is still looking for a new direction. A lot depends on one resistance line.
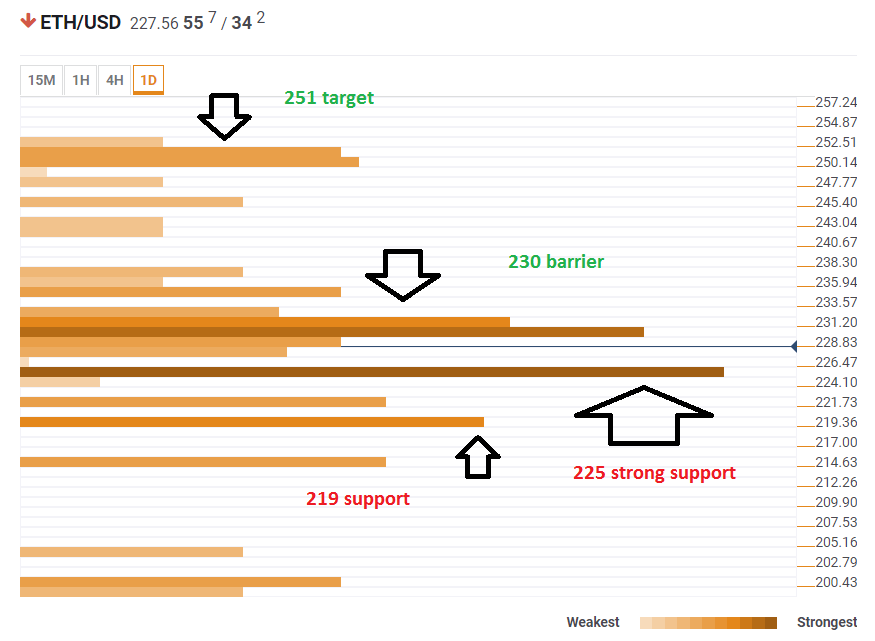
The Technical Confluence Indicator shows that the ETH/USD faces a dense congestion of resistance lines at $230. The cluster consists of the Simple Moving Average 5-one-day, the SMA10-1d, the SMA100-15m, the SMA10-1h, the SMA5-4h, the SMA50-15m, the Bollinger Band one-hour Middle, the SMA10-4h, the BB 15m-Upper, the SMA200-4h, the BB 4h-Middle, the SMA200-15m, the SMA50-1h, and the all-important Fibonacci 61.8% one-day.
If Ether breaks above this level, the next target is $251, where we see the SMA50-one-day, last week’s high, the Fibonacci 61.8% one-month, and the BB 1d-Upper.
Looking down, very strong support awaits at $225 which is the convergence of the 1d-low, the BB 4h-Lower, the SMA50-4h, the SMA200-1h, and the Pivot Point one-day Support 1.
Further support awaits at $219 which is the confluence of the Pivot Point one-day Support 2 and the Fibonacci 38.2% one-month.
Here is how it looks on the tool:
The Confluence Detector finds exciting opportunities using Technical Confluences. The TC is a tool to locate and point out those price levels where there is a congestion of indicators, moving averages, Fibonacci levels, Pivot Points, etc. Knowing where these congestion points are located is very useful for the trader, and can be used as a basis for different strategies.
Disclaimer: Foreign exchange (Forex) trading carries a high level of risk and may not be suitable for all investors. The risk grows as the leverage is higher. Investment objectives, risk appetite and ...
more

