
Energy ETF (XLE) - Breakout Test In Play, 20% Gain In Store?
(Click on image to enlarge)
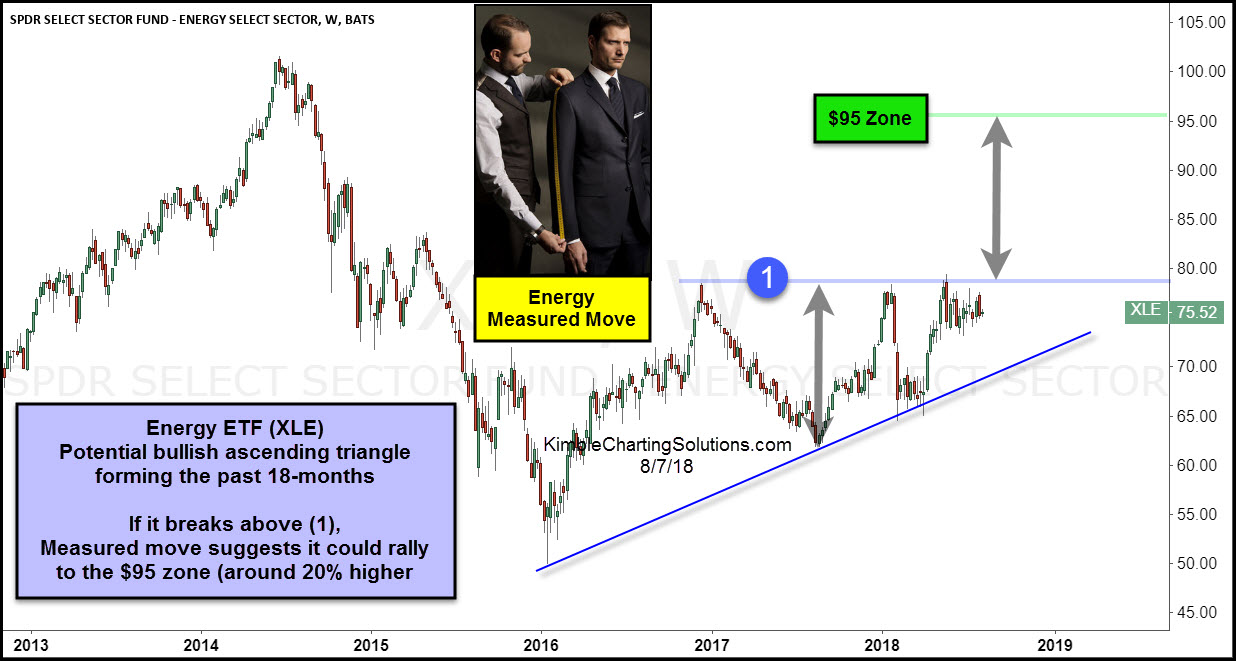
Energy ETF (XLE) has struggled to get above the $80 level while creating a series of higher lows over the past 18-months. This price action could be creating a bullish ascending triangle pattern.
The top of the pattern comes into play at the resistance line (1).
If the resistance line (1) is taken out, a “measured move” calculation suggests it could rally up to the $95 zone, which is more than 20% above current prices.
If XLE breaks out, it should attract buyers!
Sign up for Chris's Kimble Charting Solutions' email alerts--click here.
How did you like this article? Let us know so we can better customize your reading experience.

Comments
Leave a comment to automatically be entered into
our contest to win a free Echo Show.

