
Downtrend In Foreign Purchases Of US Equities Continues In May
On a 12-month rolling total basis, foreigners have been selling US stocks since January. This did not change in May.
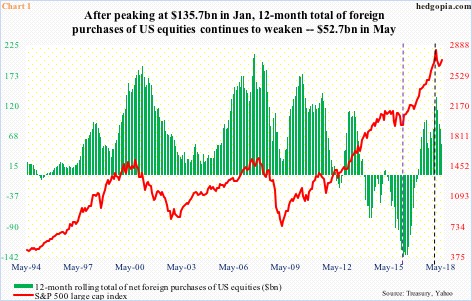
Foreigners kept turning their back on US equities in May. They sold $26.6 billion worth. Monthly data tends to be volatile. Chart 1 uses a 12-month running total. On this basis, purchases in May were $52.7 billion. Since peaking at $135.7 billion in January, purchases have gradually headed south.
Incidentally, the January peak coincided with a peak in the S&P 500 large cap index (black dashed vertical line). A similar phenomenon also took place in February 2016. Back then, foreigners sold $145.3 billion in US equities, before reversing higher. The S&P 500 reached a major bottom in that month (indigo dashed vertical line).
The S&P 500 (2815.62) still remains below its all-time high of 2872.87 reached on January 26, but off the February lows has made quite a comeback. In this respect, the TIC (Treasury International Capital) data, which contain information on foreign ownership of US securities, is slightly backward-looking in that the Treasury just published numbers for May, so it is possible June saw an uptick. Or maybe not. The S&P 500 rose 0.5 percent in June and is up 3.6 percent July-to-date. Directionally, the red line and the green bars do tend to move hand in hand.
In May, while foreigners bailed out, fund flows were positive. US-based equity funds (including ETFs) took in $19.6 billion (courtesy of Lipper). In the same month, SPY (SPDR S&P 500 ETF), VOO (Vanguard S&P 500 ETF) and IVV (iShares core S&P 500 ETF) combined gained $8.2 billion. QQQ (PowerShares QQQ ETF) took in another $2.8 billion, and IWM (iShares Russell 2000 ETF) and IJR (iShares core S&P small-cap ETF) combined attracted $3.2 billion.
Come June, this changed. In six weeks since the end of May through last Wednesday, US-based equity funds lost a whopping $45.4 billion. Similarly, since May-end through this Tuesday, SPY, VOO, and IVV collectively lost $8.5 billion, even as QQQ attracted $474 million and IWM and IJR combined took in $822 million.
The point is, it is possible foreigners upped their purchases in June and July. A lack thereof is worth watching, as historically sooner or later the red line will catch up with the green bars.
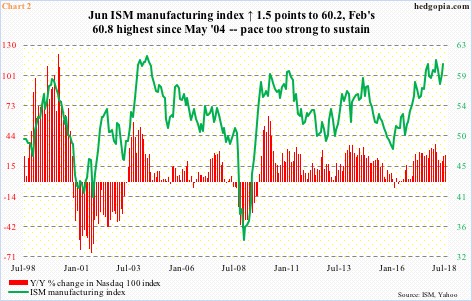
This is similar to Chart 2, which too bears watching in the months ahead. The ISM manufacturing index has been plotted against year-over-year change in the Nasdaq 100 index. Month-to-month correlation may not be perfect, but over the long term the two do move together.
US manufacturing in June rose 1.5 points month-over-month to 60.2. February’s 60.8 was the highest since May 2004. It is hard to sustain above 60, let alone high-50s. Economy activity in 2Q was strong. As of July 18, the Atlanta Fed’s GDPNow model forecasts 4.5 percent growth in the quarter – once again a pace impossible to sustain. (The advance estimate of 2Q GDP is due out Friday next week.) If activity softens in 2H18, odds are the Nasdaq 100 will catch up to it. At least that is how it has been historically. In this scenario, unless the prevailing trend reverses, foreigners will provide a headwind to US stocks.
Disclaimer: This article is not intended to be, nor shall it be construed as, investment advice. Neither the information nor any opinion expressed here constitutes an offer to buy or sell any ...
more

