
Dow Futures Push Into Support Setting Up DJIA Bullish Reversal
Dow futures are down -0.07% overnight after the Dow Jones Industrial Average finished in the green for 2 weeks in a row. Friday’s sell off in price occurred near a peculiar place in the technical picture for the Dow Jones Industrial Average.
From last Thursday’s report:
“[T]hen price action around 16,831 will help clear up the near term pattern and we can begin to dial in targets for the remainder of the move.”
Early Friday morning, the US30, a CFD which tracks the Dow Jones Industrial Average, turned lower at 16,845. There were two strong wave relationships appearing in that zone and the subsequent price rejection is the market expressing their importance to us. As a result, two higher probability patterns we are watching suggest a slight softening of prices further, then a rebound higher that carries prices above 17,000.
Dow Jones (ticker: US30) Searching for Support
(Click on image to enlarge)
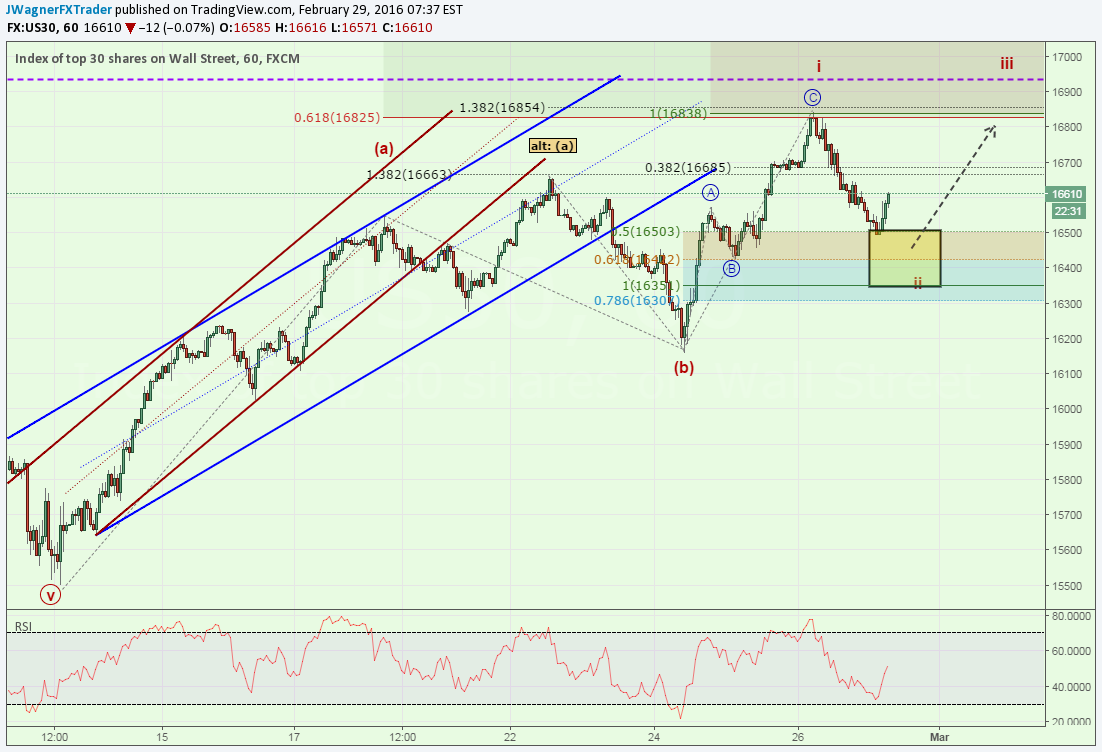
Zooming in and performing Elliott Wave analysis, the move from February 24 to February 25 stands out like a sore thumb and is clearly an equal wave move. That is to say the second leg higher (blue circle ‘c’) is equal in length to the first leg higher (blue circle ‘a’). This small pattern favors a ‘B’ wave of an expanded flat or this is the first leg of a bullish ending diagonal (pictured above). In both scenarios, we cannot rule out a slight softening of prices prior to a rebound that likely carries into 17,000.
Though both patterns are the preferred possibility, we are favoring the bullish ending diagonal pattern. The difference is slight in that prices probably grind higher in the bullish diagonal. In the expanded flat, we may see a deeper retracement lower that leads to an impulsive move higher.
The bullish diagonal may find support near 16,410 - 16,500. This morning, we are already seeing prices bound higher. A move about the February 25 high of 16,845 would tip the hand to the bullish ending diagonal. This ending diagonal pattern becomes invalidated on a print below the February 24 low at 16,161.
The expanded flat technical support doesn’t begin until 16,350 and possibly as low as 16,000. Once support is found, prices would begin a rally under the pattern’s interpretation.
As a result, a trader can look to implement a buy the dip type of strategy for intraday trades.
If for some reason, prices break down below the February 11 low of 15,500, then the premise of this analysis is incorrect and we will look to assess other alternative patterns at play. Once such pattern is that the (c) wave terminated at the February 26 high. An impulsive sell off would elevate this as a preferred wave count should prices falter below 15,500.


