
Doc Copper- Potential Topping Pattern, Says Joe Friday
(Click on image to enlarge)
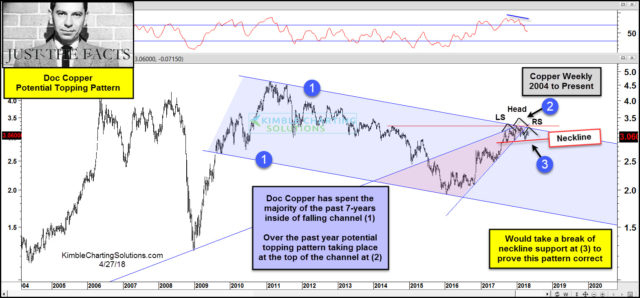
The long-term trend of Doc Copper remains down, as it has created a series of lower highs and lower lows inside of falling channel (1) over the past 7-years. It hit the bottom of the channel in late 2015, where it found support and a rally has taken place the past 3-years.
The rally now has Doc Copper testing the top of the falling channel, where a potential topping pattern (Head & Shoulders Pattern) could be taking place at (2), as momentum is lofty and could be turning down.
Joe Friday Just The Facts– Doc Copper could be creating a topping pattern over the past year, at the top of this long-term falling channel.
(Click on image to enlarge)

While Doc Copper it testing the underside of its long-term falling channel, bullish sentiment is high, near the levels hit as Copper topped back in 2011, according to Sentimentrader.com.
Interest rates/yields have followed Doc Coppers price pattern over the past few years, as both hit channel support in 2015/2016-
(Click on image to enlarge)
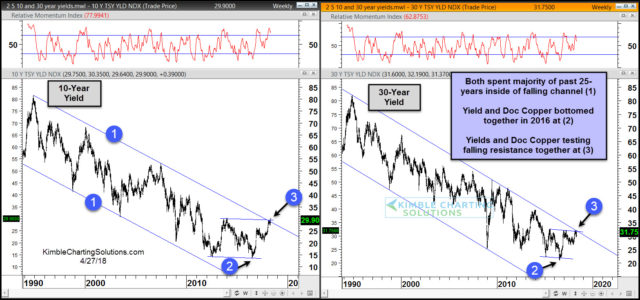
Doc Copper and Yields both remain inside of long-term falling channels with momentum lofty. Both are testing breakouts at top of these falling channels at the same time.
What Doc Copper and Yields do at the top of the channels could tell us a ton about inflation,growth prospects, interest rates, and the future of commodity prices going forward!
Sign up for Chris's Kimble Charting Solutions' email alerts--click here.


