
Dividend Aristocrats & The Sharpe Ratio: Part 2
<<Read Part 1: Dividend Aristocrats & The Sharpe Ratio
In Part 1, the efficacy of investing in the Dividend Aristocrats Index was discussed. In addition, the current list of Dividend Aristocrats sorted by 10 year sharpe ratio was presented.
In Part 2 of the 4 Part Dividend Aristocrats & The Sharpe Ratio series, I will take a look at the valuation adjusted Sharpe Ratio of each of the current Dividend Aristocrats.
Sharpe Ratio Valuation Adjustment
The Sharpe ratio takes the total return (less the risk free rate, which we are setting to 0 in these articles) and divides it by price standard deviation. The Sharpe ratio measures risk-adjusted-return. The higher the Sharpe ratio, the better.
I am more interested in underlying business growth than price returns. If the price-to-earnings ratio of a stock doubles, while earnings-per-share do not increase, the underlying business did not grow. The stock price increased due more to ‘luck and perception’ than to actual underlying business growth. Luck and perception does not generate solid long-term returns. Underlying business growth does.
Valuation Adjustment Methodology
Instead of using total return in the numerator of the Sharpe ratio, we will adjust total return for valuation multiple changes. There is no one perfect way to do this. Every metric has its pitfalls. With that said, revenue and book value tend to be more stable than earnings.
As a result, for non-financial stocks, adjusted total returns will be calculated as total return divided by the change in the price-to-sales ratio. For financial stocks, adjusted total returns will be calculated as total returns divided by the change in the price-to-book ratio.
For example: If a stock had a 10% annualized total return over the 10 year period used, and the starting price-to-sales ratio was 2 while the ending price-to-sales ratio was 4, annualized total return would be divided by 2 and equal 5% to better reflect underlying business growth (including returns from dividend payments).
Dividend Aristocrats Results
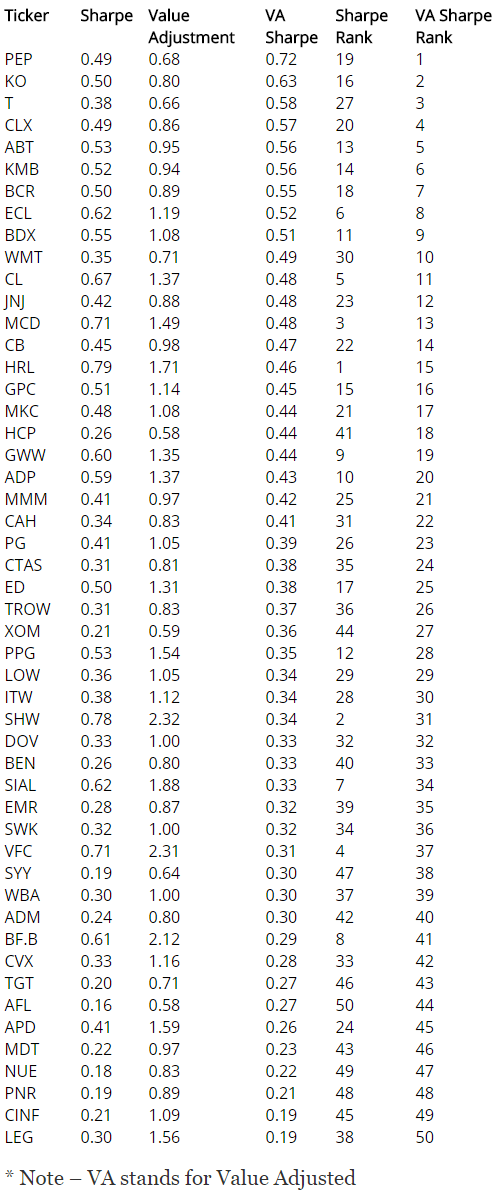
The valuation adjusted Sharpe ratio for 50 of the 52 current Dividend Aristocrats (ABBV and MHFI are excluded due to spin-offs and shorter histories) is shown below:
Click here to download this data in an Excel spreadsheet.
Comments on Dividend Aristocrat Results
Interestingly, the Dividend Aristocrats that had the best business results tended to see their valuation multiples fall over the last decade. This is true of the top 7 best value-adjusted Sharpe ratio performing stocks. This means that the market predicted that these stocks would have superior returns, and bid up their price accordingly. As they grew (as the market predicted), their valuation multiples fell, partially offsetting growth.
This underscores the importance of low valuation multiples in stock price returns. The best 12 performing stocks using the Sharpe ratio over the last decade (not adjusting for value) all saw their valuation multiples increase.
Based on the findings of part 2 of this study, it is wisest to invest in high quality businesses with long dividend histories that are likely to continue growing that also have lower than average valuation multiples.
Up Next: Dividend Aristocrats & the Sharpe Ratio Part 3 of 4
In part 3 of 4 of this study on Dividend Aristocrats and the Sharpe ratio, we will look at the performance of a strategy that invests in the highest Sharpe ratio Dividend Aristocrats and holds for 1 year.
>> Read Part 2: Dividend Aristocrats & the Sharpe Ratio
Disclosure: None.


