Wednesday, November 7, 2018 3:58 AM EDT
Crude oil prices slumped, suffering the seven consecutive day in the red to make for the longest losing streak since April 2017. That followed an EIA report predicting the biggest increase in US oil production on record in 2018. API data showing inventories added a hefty 7.83 million barrels last week reinforced the move. Gold prices edged lower as yields rose in risk-on trade, sapping the appeal of non-interest-bearing assets.
CRUDE OIL EYES INVENTORY DATA, GOLD MAY FALL AS YIELDS RISE
Looking ahead, the spotlight turns to official DOE inventories data. Forecasts envision an increase of 1.63 million barrels, with an outcome closer to the API projection threatening to compound downside pressure. Gold may continue to suffer in the meanwhile as S&P 500 futures point to another risk-on day on the sentiment front, which may keep bond yields on the upswing.
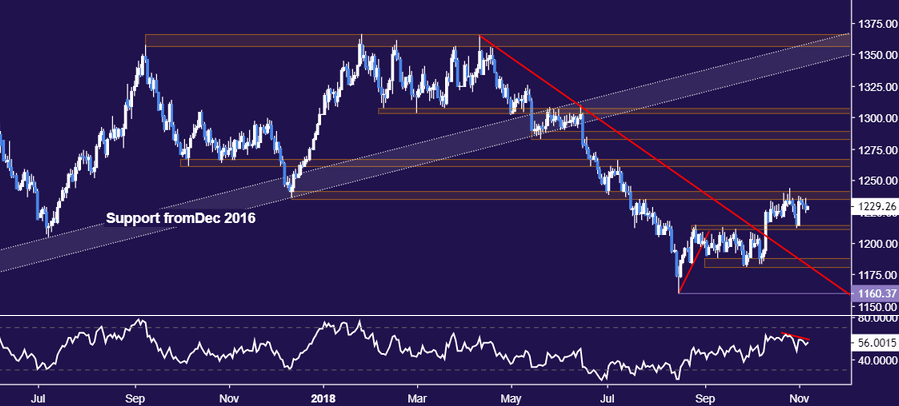
GOLD TECHNICAL ANALYSIS
Gold prices continue to mark time near resistance in the 1235.24-41.64 area. A daily close above this threshold targets the 1260.80-66.44 region next. Alternatively, a turn below support in the 1211.05-14.30 paves the way for a challenge of the 1180.86-87.83 zone.
(Click on image to enlarge)
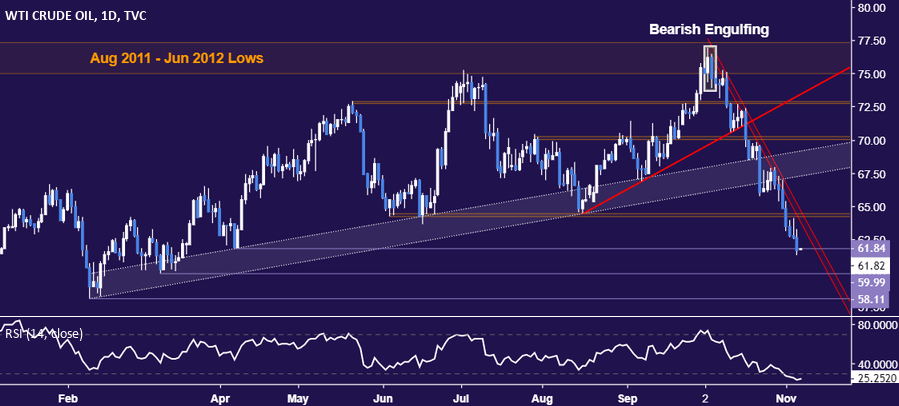
CRUDE OIL TECHNICAL ANALYSIS
Crude oil prices broke support marked by the April 6 low at 61.84, opening the door for a test of the $60/bbl figure. A daily close below that exposes the February 9 bottom at 58.11. Alternatively, a turn back above the 64.26-45 area targets support-turned-resistance at 67.25. Weekly chart positioning hints a major top is set.
(Click on image to enlarge)
Disclosure: Do you want to see how retail traders are currently trading the US Dollar? Check out our IG Client Sentiment ...
more
Disclosure: Do you want to see how retail traders are currently trading the US Dollar? Check out our IG Client Sentiment Indicator.DailyFX, the free news and research website of leading forex and CFD broker FXCM, delivers up-to-date analysis of the fundamental and technical influences driving the currency and commodity markets. With nine internationally-based analysts publishing over 30 articles and producing 5 video news updates daily, DailyFX offers in-depth coverage of price action, predictions of likely market moves, and exhaustive interpretations of salient economic and political developments. DailyFX is also home to one of the most powerful economic calendars available on the web, complete with advanced sorting capabilities, detailed descriptions of upcoming events on the economic docket, and projections of how economic report data will impact the markets. Combined with the free charts and live rate updates featured on DailyFX, the DailyFX economic calendar is an invaluable resource for traders who heavily rely on the news for their trading strategies. Additionally, DailyFX serves as a portal to one the most vibrant online discussion forums in the forex trading community. Avoiding market noise and the irrelevant personal commentary that plague many forex blogs and forums, the DailyFX Forum has established a reputation as being a place where real traders go to talk about serious trading.
Any opinions, news, research, analyses, prices, or other information contained on dailyfx.com are provided as general market commentary, and does not constitute investment advice. Dailyfx will not accept liability for any loss or damage, including without limitation to, any loss of profit, which may arise directly or indirectly from use of or reliance on such information.
** All times listed in GMT. See the full DailyFX economic calendar here.
less
How did you like this article? Let us know so we can better customize your reading experience.


