
Crude Oil Prices Hold Up But Gold Sinks As Risk Appetite Fizzles
Crude oil prices managed a narrow gain Thursday despite an otherwise broadly risk-off day across financial markets. An unexpectedly large drop in US inventories seemed to continue offering support. Soundbites from Iran appeared to help as Tehran again threatened to stop exports to the Middle East altogether if US-backed sanctions prevent it from shipping through the critical choke-point in the Strait of Hormuz.
Gold prices were not so lucky however as haven-seeking capital flows buoyed the US Dollar, sinking the perennial anti-fiat alternative. Emerging markets buckled as Argentina asked the IMF to speed up payment on a $50 billion credit line, rekindling worries about the knock-on effects of Fed-driven rise in global borrowing costs. Meanwhile, US President Trump threatened China with yet more tariffs.
MARKET TURMOIL MAY EASE ON WEEKEND GAP RISK
Looking ahead, a relatively muted offering on the economic calendar is likely to keep sentiment trends in the spotlight. With yesterday’s worries unresolved, the path of least resistance seems to favor continued risk aversion. Bellwether S&P 500 futures are conspicuously flat in late Asia Pacific trade however, hinting that traders mindful of weekend gap risk may opt to delay follow-through.
Policymakers across the globe are no doubt scrambling to address the various flashpoints worrying investors. A breakthrough on one of these fronts over the weekend might make for a substantive disparity between Monday’s trading open and Friday’s close for sentiment-sensitive assets. With that in mind, market participants may hold off on increasing anti-risk exposure further, at least for now.
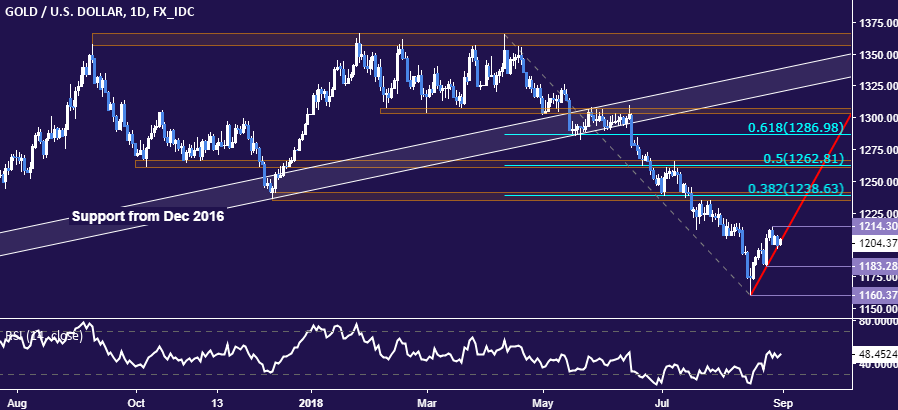
GOLD TECHNICAL ANALYSIS
Gold prices continue to hover at a counter-trend line guiding the upswing from mid-August lows. A break lower would hint that the down move from mid-April has resumed, with the August 24 low at 1183.28 emerging as the next layer of support. Alternatively, a push back above the August 28 high at 1214.30 targets the 1235.24-41.64 area (Dec’17 support, 38.2% Fibonacci retracement).
(Click on image to enlarge)
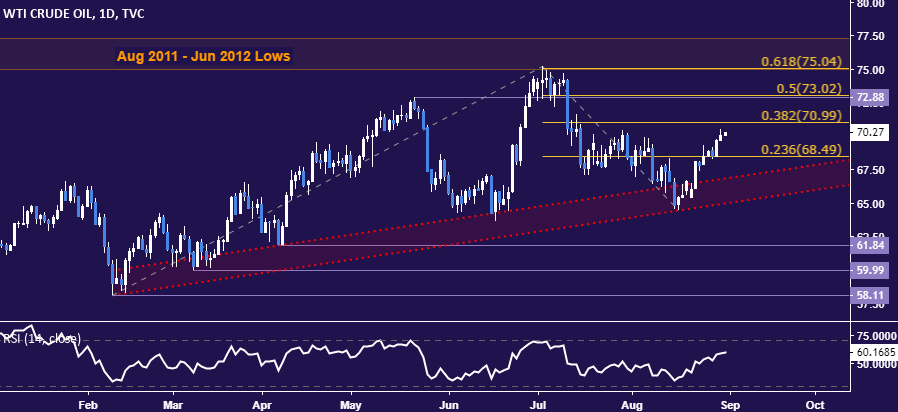
CRUDE OIL TECHNICAL ANALYSIS
Crude oil prices continue to rise toward resistance marked by the 38.2%Fibonacci expansion at 70.99. A break above this barrier confirmed on a daily closing basis opens the door for a test of the 72.88-73.02 area (May 22 high, 50% level). Alternatively, a reversal back below the 23.6% Fib at 68.49 exposes rising trend support in the 65.02-66.87 zone.
(Click on image to enlarge)
Disclosure: Do you want to see how retail traders are currently trading the US Dollar? Check out our IG Client Sentiment ...
more

