
Crude Oil Prices Eye JODI Data, Gold May Fall On Fed-Speak
Crude oil prices edged higher for a third consecutive day Friday, extending a tepid recovery after the largest one-day drop in two years put the exclamation point on the longest run of consecutive losses on record. The bounce has been nominally linked to speculation about an OPEC-led production cut next year, although it isn’t clear that a correction would not have emerged in any case.
The spotlight now turns to monthly import and export flow data from the Joint Organizations Data Initiative (JODI), a collaborative effort from international data-gathering institutions including the EIA, Eurostat, and OPEC. If the results underscore worries about oversupply as US output swells while demand cools, selling pressure may re-emerge.
GOLD PRICES MAY FALL ON COMMENTS FROM FED’S WILLIAMS
Gold prices pushed higher Friday, buoyed by a dovish shift in Fed rate hike bets that weighed heavily on the US Dollar. The move appeared to be inspired by a cautious turn in commentary from central bank officials, which seemed to suggest external instability (such as political turmoil in Europe or financial stress in emerging market economies) may reduce the scope for further tightening.
This may prove to be an over-interpretation. The Fed has long signaled that it is carefully monitoring developments abroad but understandably intends to prioritize domestic concerns in policy-setting. To that end, the improvement in US economic data outcomes relative to forecasts over recent weeks hardly suggests a slowdown in stimulus withdrawal is in the offing.
Upcoming remarks from New York Fed President John Williams – a bellwether centrist voice on the rate-setting FOMC committee – may well inspire a rethink. The Greenback may recover as yields rise if he reiterates domestic data dependence as the guiding principle driving Fed policy decisions. Needless to say, such an outcome would bode ill for the yellow metal.
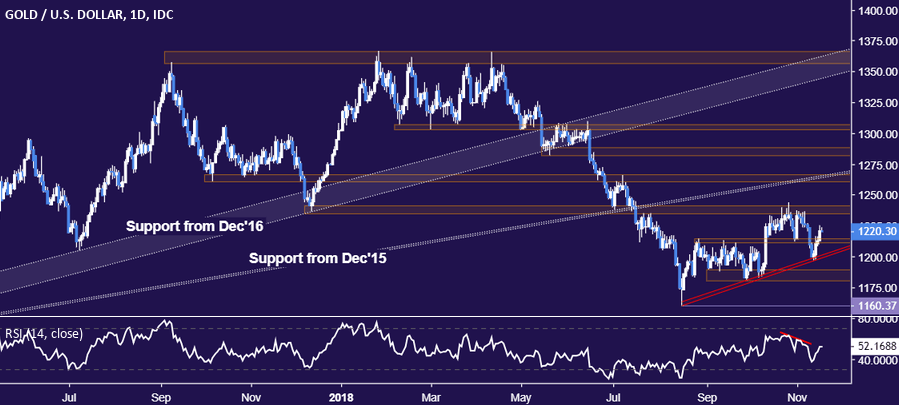
GOLD TECHNICAL ANALYSIS
Gold prices pushed through support-turned-resistance in the 1211.05-14.30 area, exposing another former downside barrier in the 1260.80-66.44 zone to a retest. A break above that targets still further earlier support in the 1260.80-66.44 region. Alternatively, a move back below 1211.05 targets a rising trend now squarely at the $1200/oz figure.
(Click on image to enlarge)
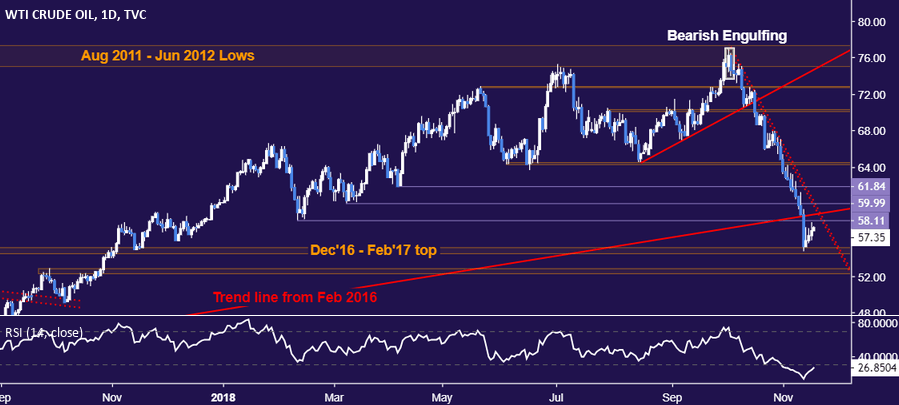
CRUDE OIL TECHNICAL ANALYSIS
Crude oil prices are correcting cautiously higher after testing support in the 54.48-55.21 area. A web of a back-to-back and overlapping resistance levels is capped at the $60/bbl figure, with a break above that invaliding the immediate bearish bias and exposing former support at 61.84. Alternatively, a daily close below 54.48 clears the way for a challenge of the 52.34-83 zone.
(Click on image to enlarge)
Disclosure: Do you want to see how retail traders are currently trading the US Dollar? Check out our IG Client Sentiment ...
more

