
Crude Oil And Invalidation Of Breakout
On Tuesday, crude oil wavered between small gains and losses, but finally closed another day under the upper border of the short-term rising trend channel. Will this show of oil bulls’ weakness trigger further deterioration in the coming days? Will the relationship between black gold and oil stocks give us more clues about future moves?
Crude Oil’s Technical Picture
Before we answer this question, let’s examine the technical picture of crude oil (charts courtesy of http://stockcharts.com).
(Click on image to enlarge)
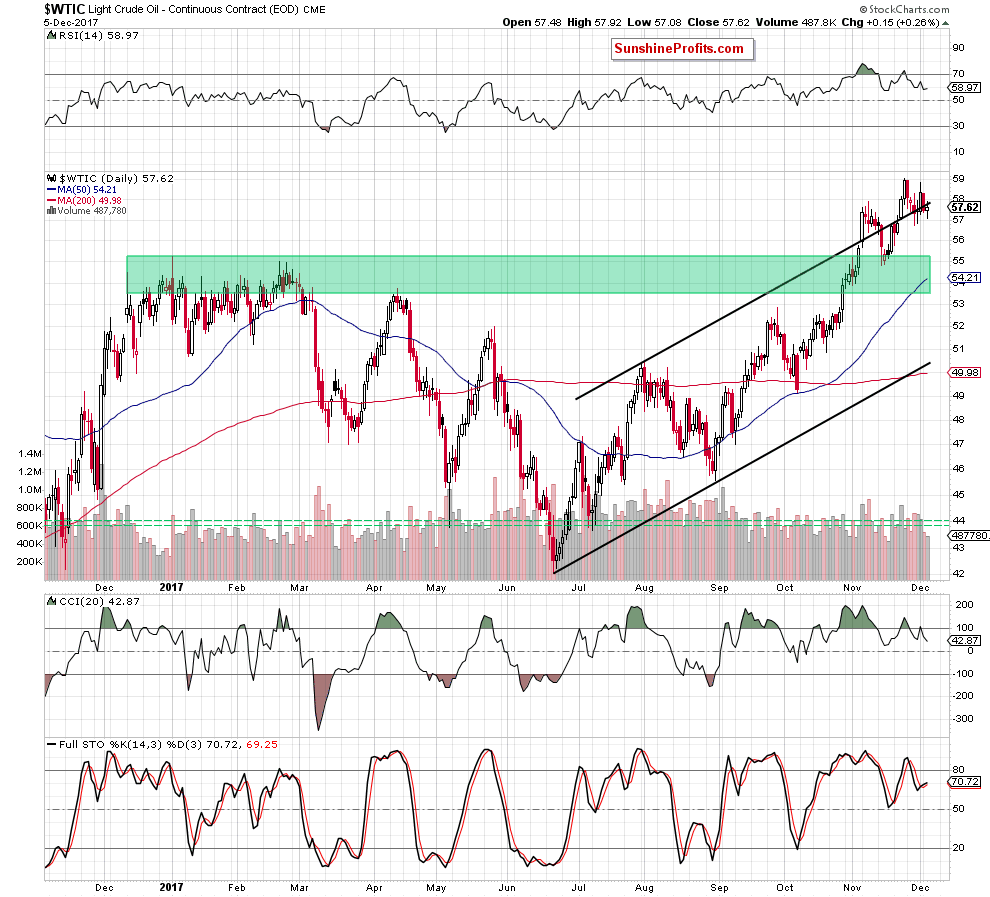
Looking at the daily chart, we see that although oil bulls managed to stop declines after the market open and triggered a rebound, black gold closed yesterday’s session under the upper border of the short-term rising trend channel. Such price action looks like a verification of the Monday breakdown, which doesn’t bode well for oil bulls and higher prices of black gold in the coming days.
Additionally, the size of volume, which accompanied yesterday “increase” was smaller than day earlier, which together with the sell signals generated by the RSI and the CCI suggests that the comeback of oil bears is just a mater of time (most likely a short period of time).
The pro bearish scenario is not only reinforced by the broader picture of crude oil and negative divergences between the WTIC:UDN and the price of crude oil priced in the U.S. dollars (we wrote more about these issues in our Monday Oil Trading Alert), but also by the current situation in the oil-to-oil stocks ratio.
Relationship between Crude Oil and Oil Stocks
(Click on image to enlarge)
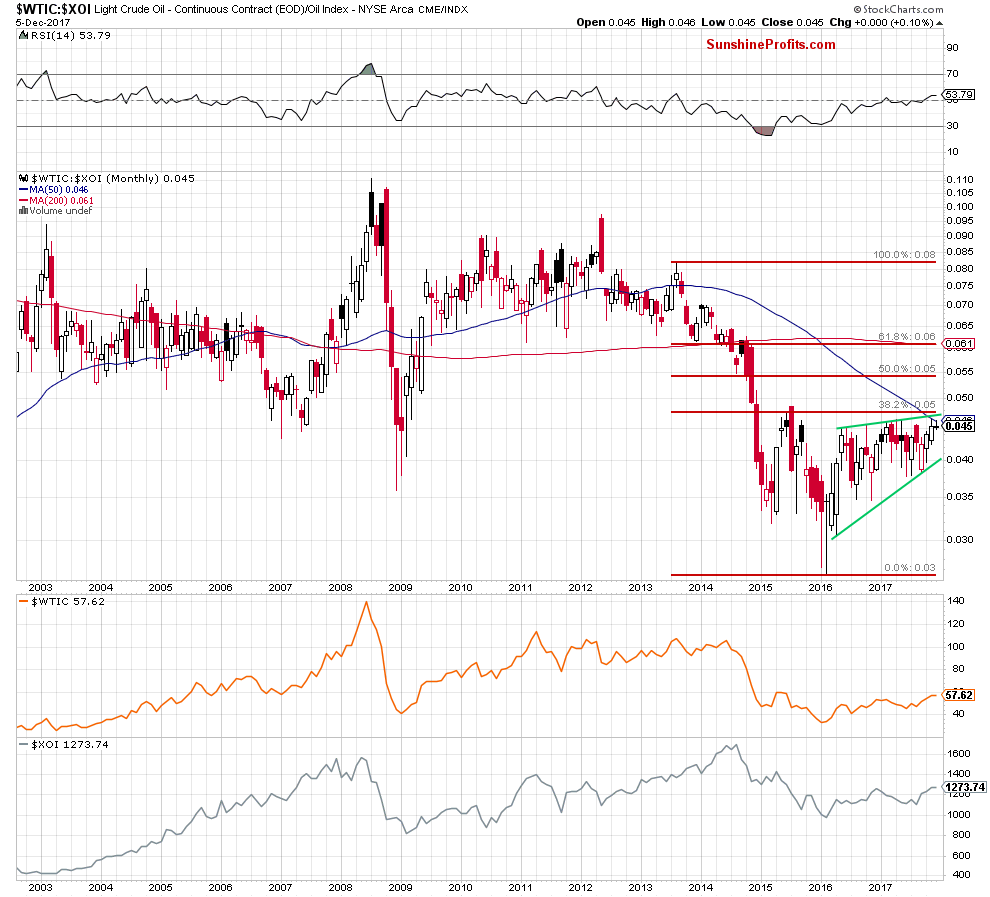
Looking at the monthly chart, we see that although the ratio increased in the previous month, the 50-month moving average together with the proximity to the upper border of the green rising wedge and the 38.2% Fibonacci retracement stopped the bulls, triggering a pullback. Earlier this month, we saw another unsuccessful attempt to move higher, which suggests that a bigger move to the downside may be just around the corner.
At this point, it is worth noting that we saw similar situations in June 2016 and March, April and May 2017. In all these cases, unsuccessful breakouts resulted in declines in the following month(s), which increases the probability that the history will repeat itself and we’ll see another downward move in the coming month.
Additionally, when we take a closer look at the medium-term chart, we’ll see that the ratio invalidated the earlier tiny breakout above the upper border of the red gap, the previous peaks and the blue dashed resistance line, which is a strong bearish development.
(Click on image to enlarge)
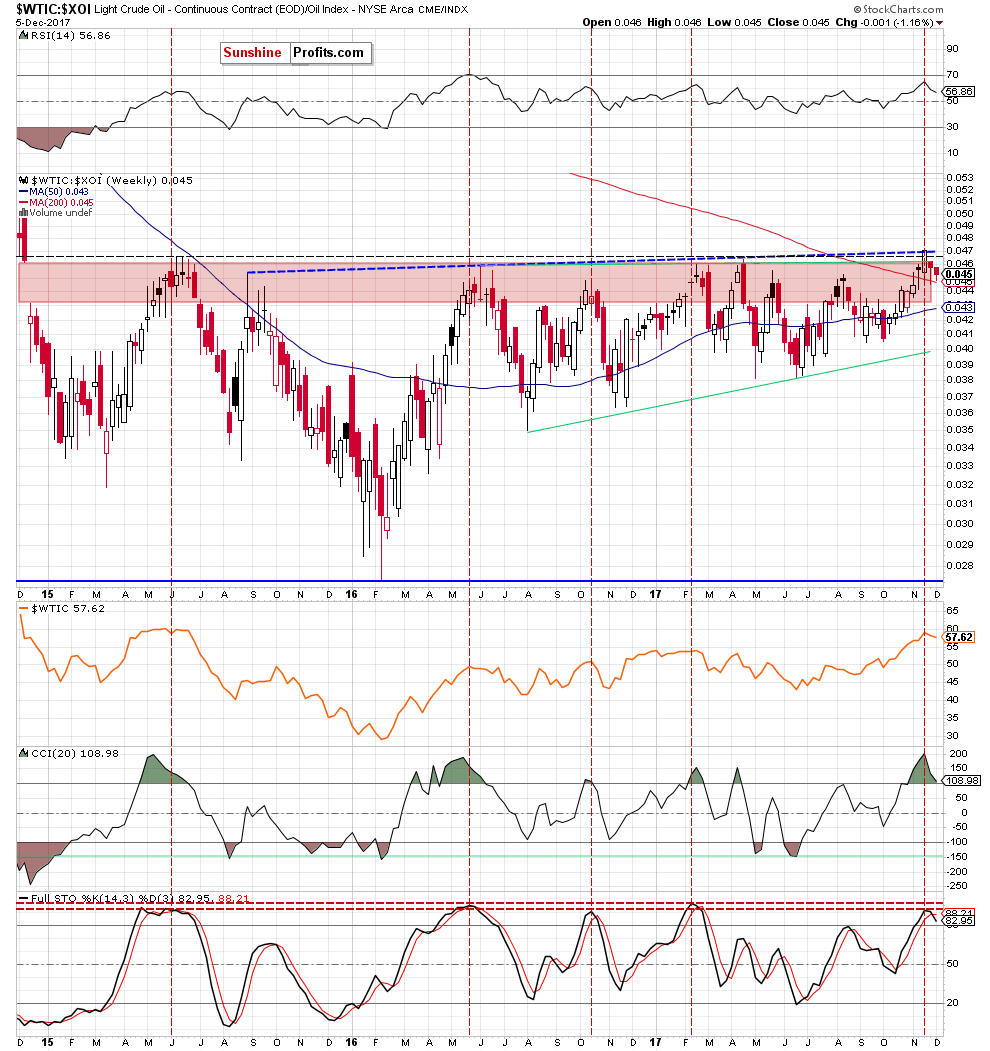
Why? As you see on the above chart, there were similar attempts to close the gap many times in the previous years, but they all failed, which encouraged the bears to act and trigger declines in the following weeks.
What does it mean for crude oil? Taking into account a positive correlation between the commodity and the ratio, we believe that declines in the latter case will also affect negatively the price of crude oil. If this is the case, we’ll see a realization of the bearish scenario from our Monday alert:
(…) How low could crude oil go if oil bears show their strength in the coming weeks? In our opinion, if light crude extends losses from current levels, we’ll see (at least) a drop to around $54.81-$55.24, where the January peak and the mid-November lows are. If this support area is broken, the way to lever levels will be open.
Summing up, short positions continue to be justified from the risk/reward perspective as crude oil verified the breakdown under the upper border of the black rising trend channel. The pro-bearish scenario is also reinforced by the current situation in the oil-to-oil stocks ratio, which increases the probability of further declines in the coming week(s).
Very short-term outlook: bearish
Short-term outlook: mixed with bearish bias
MT outlook: mixed
LT outlook: mixed


