
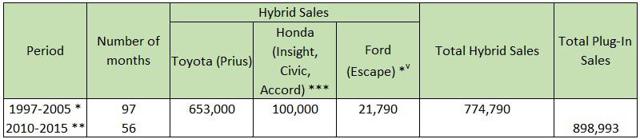
It should be clear by now that EVs are winning against conventional hybrids in their respective initial years of adoption. As we can see in an updated version of a table I published in 2014, in their initial 97 months of introduction, 774,790 hybrids were sold, whereas in only 57 months of adoption, 898,993 plug-ins were retailed (See Table 1). In essence, what this means is that plug-ins are in fact being adopted at a much faster pace than conventional hybrids. Still, in July 2015, Toyota (NYSE:TM) announced it had crossed the 8 million hybrid mark while plug-ins would have recently reached the one-million global plug-in sales milestone only.
Table 1
World: Hybrid and Plug-In Comparable Sales Since Their Launching
Sources: For hybrid sales:
,
, and
. For plug-in sales:
,
, and
.
*December 1997-December 2005.
**December 2010-July 2015.
***Number corresponds to period November 1999-April 2005.
*v Number corresponds to 2004 and 2005.
At first sight, this ample margin in favor of Toyota would give the impression that its future with hybrids is bright. However, the Japanese giant automaker has at this juncture at least two reasons to worry. For one thing, there appears to be some evidence that Toyota Prius sales are beginning to "lose their charge" (See Figure 1). For another, plug-in sales seem to be growing exponentially (See Figure 2) which may conspire against Toyota's efforts to position its newest fuel cell electric vehicle model (i.e. the Mirai) in the market.
Figure 1
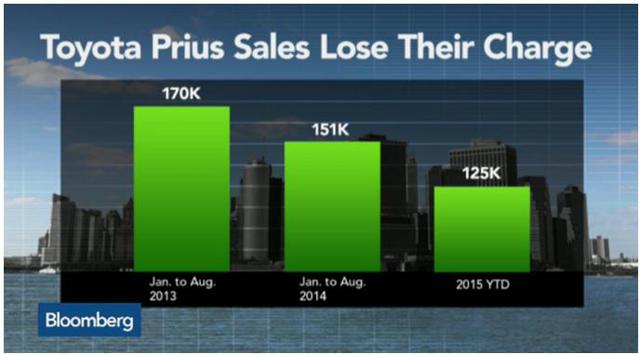
Source: Cleantechnica.com
Figure 2
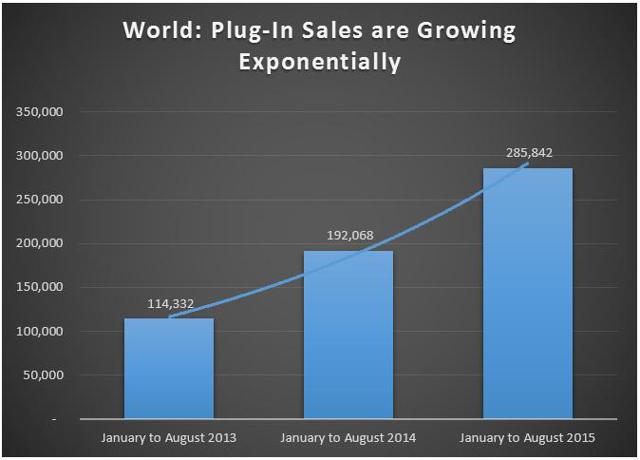
Source: Ev-sales.blogspot.com
In this article, I take up the first issue mentioned above only, leaving the second one for a forthcoming contribution. Just as the rise of Toyota hybrid sales since 1997 were mostly related to a hike in oil prices, the recent decline now seems to be linked to dipping fossil fuel values. To the extent that the current falling oil prices are likely to be a permanent rather than a conjectural phenomenon, they could eventually drive down Toyota hybrid sales even further. But can this apparent positive correlation between Toyota hybrids and oil prices be thought of as a positive causal connection between these two variables as well?
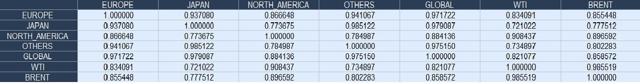
In what follows, I will intend to show that there's a causal mechanism running from oil prices to Toyota's hybrid sales. But, before I do that, let me describe the extent of the positive correlation between the two variables. In Table 2, the correlation matrix of Toyota hybrid sales in Europe, Japan, North America, other countries, and in the world (GLOBAL), and WTI and Brent oil prices is presented. In all cases, correlations between Toyota hybrid sales and oil prices are high and positive. Please note that correlations among Toyota hybrids sales themselves in different parts of the world and globally are also high and positive.
Table 2
Correlation Matrix Between Oil Prices and Toyota's Hybrids
But can these results hold up to a causal association between Toyota hybrid sales and oil prices? For reasons of space and time, I will restrict my analysis now to one fundamental relationship: That between Toyota global hybrid sales (GLOBAL) and WTI oil prices (WTI) (See Figure 3).
Figure 3
Evolution of GLOBAL and WTI
1997-2014
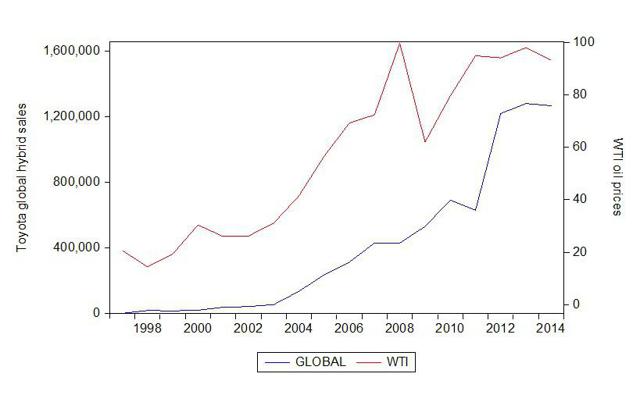
Source: Toyota and EIA
In accordance with standard econometric practice, it appears reasonable to proceed as follows: First, test for stationarity of the two variables in their level form (i.e. own values) to find their order of integration. Second, check for cointegration between hybrid sales and oil prices. Third, test for unidirectional Granger causality running from WTI oil prices to Toyota's global hybrid sales.
Stationarity
To see if the variables are stationary, we need to test for unit roots. The whole issue about testing for unit roots arose when econometricians discovered that many macroeconomic variables are non-stationary, because they can be described as a "random walk" (i.e. a process where the current value of a variable is composed of the past value plus an error term defined as a white noise (a normal variable with zero mean and variance one)) even after a deterministic trend is removed. It then became apparent that running regressions with that kind of data could lead to misleading values of R2, Durbin-Watson and t statistics.
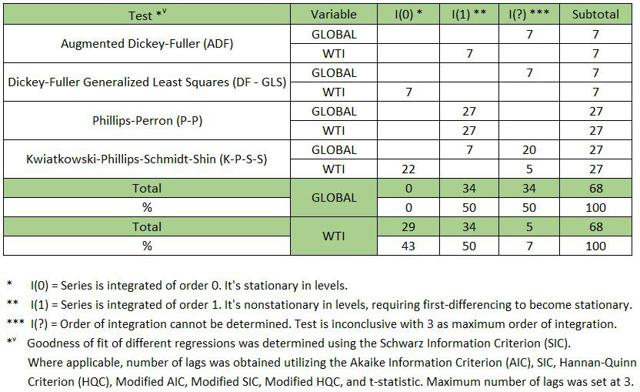
In this piece, four kinds of tests were performed to search for unit roots in the two variables, namely: Augmented Dickey-Fuller, Dickey-Fuller Generalized Least Squares (GLS), Phillips-Perron, and Kwiatkowski-Phillips-Schmidt-Shin tests. It must be noted that the first three are similar tests in the null (i.e. the variable has a unit root), whereas the last one uses the opposite null (i.e. the variable is stationary). Considerable research has been done on unit roots in the last three decades or so. In many ways, this effort is ongoing, and from time to time, we are still subjected to contradictory results among the different tests. This is somewhat worrisome since these tests are the first indispensable step to perform both cointegration and causality tests.
Using EViews, a popular econometric software, a total of 68 unit root tests were implemented. This implied considering all the corrections included in the different tests. Table 3 summarizes the results of this exercise. As it can be seen, GLOBAL was found to be integrated of order one (I(1)) in 71% of tests while it was not possible to conclude anything with WTI, since in 50% of cases, the variable appeared to be stationary or integrated of order 0 (I(0)), and in another 50% of tests, it was seen to be integrated of order 1 (I(1)).
Table 3
Results of Unit Root Tests for Variables
Cointegration
Economists have shown interest in the concept of cointegration because it gives a rationale for testing for and estimating long-run (equilibrium) associations among economic variables. If two variables are cointegrated, then regressing one on the other will produce residuals that are I(0). Hence in order to test for cointegration, we should apply a unit root test to these residuals. Lastly, if cointegration is found, we may have to use the lagged residuals from the cointegrating regression as an error correction term in an Error Correction Model (ECM).
The results in Table 3 inhibit us from applying standard econometric theory (See Kennedy for further details) to test for cointegration. In fact, since our two variables weren't found to be integrated of the same order (ONE), we can't estimate a long-run "level model" as well as a "restricted" ECM model. To take care of this problem, we need to implement a "Bounds Tests" which allows us to see if a long-run relationship exists when that consists of both stationary and non-stationary variables. Here we utilize the procedure suggested by David Giles (including a time trend variable) in the following "unrestricted ECM" estimating equation...

...where Δ is the first difference operator; α, β, are the coefficient parameters of the "restricted" ECM; m is the optimal lag lengths selected based on the SIC; θ0 and θ1 are the coefficient parameters of the "unrestricted" ECM; TREND is the time trend variable; and μ t is the white noise error term.
In Table 4, the corresponding regression results are presented. As we can see, except for the coefficient parameter of ΔWTI, all coefficients appear to be highly significant. Note, however, that the t-statistic for this variable is > 1, which fully justifies its inclusion in the estimating equation.
Table 4
Regression Results of the Unrestricted ECM Estimating Equation
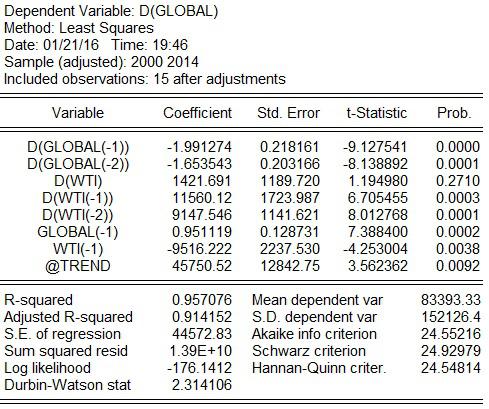
Next, we perform a Wald test to see if we can reject the null hypothesis that θ1 and θ2 are equal to zero against the alternative hypothesis that the opposite is the case. In Table 5, we show the results of the Wald test where it's clear that the null hypothesis is rejected at a very low p-value (0.0003). So the value of our F-statistic is 30.72, and we are ready to go to the Bounds Test tables of critical values developed by Pesaran et al with k=1, where we find that all critical values are way below our F-statistic, which allows us to reject the null that θ1 and θ2 are equal to zero and conclude that there is evidence of a long-run positive association between Toyota global hybrid sales and WTI oil prices. In addition, following Giles, we can also calculate the long-run multiplier between GLOBAL and WTI by dividing the estimated θ2 by the estimated θ1 as follows: -((- 9516.222)/0.951119) = 10,005.29. Other things being equal, this number would mean that an increase (decrease) of one unit in WTI oil prices will lead to an increase (decrease) of 10,005 Toyota hybrids sold in the world.
Causality
We are now in a position to fit a "restricted ECM". For that, we need to estimate the levels model...

...obtain the residual series, and incorporate it in the following equation...

...where ECGWTI t-1 and φ are the lagged residual series obtained from the levels model and its coefficient parameter, respectively.
Table 5
Wald Test Results for the Unrestricted ECM Estimating Equation

Following the procedure put forward by a 2015 article published on Renewable & Sustainable Energy Reviews - RSER - available online here, we apply the Granger causality test in the ECM framework as suggested by Engle and Granger in 1987.
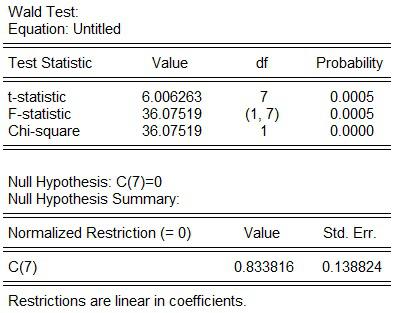
In this connection, the ECM Granger causality approach can be tested in two ways: One, a short-run Granger causality is verified by testing βj = 0, under the null hypothesis of no causality, and βj ≠ 0, under the alternative hypothesis of causality. And two, a long-run Granger causality is examined by testing φ = 0 under the null hypothesis of no long-run relationship between GLOBAL and WTI and φ ≠ 0 under the alternative hypothesis of long-run association between the two variables under consideration. The results of this exercise are shown in Table 6. As in the case of the "restricted ECM", except for the coefficient parameter of ΔWTI, all coefficients appear to be highly significant. Nevertheless, the t-statistic for this variable is > 1, which fully justifies its inclusion in the estimating equation. The last step in this procedure consists of testing for short-run and long-run Granger causality. This is done again by means of a Wald test, the results of which are shown in Tables 7 and 8. As it can be seen, in both cases, the null hypothesis is rejected at 1% level of significance, which validates the view that WTI Granger causes GLOBAL in the short run as well as in the long run.
Table 6
Unidirectional ECM Granger Causality Running from WTI to GLOBAL - Regression Results
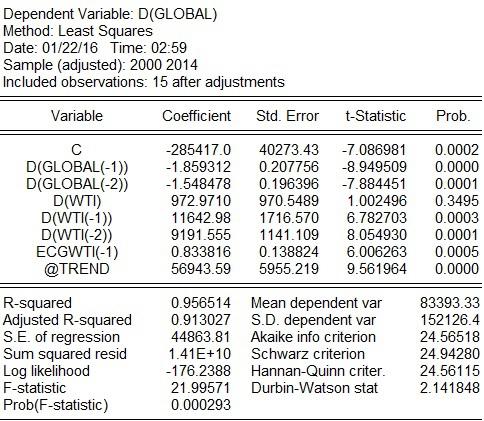
Table 7
Wald Test Results for the Short-Run Granger Causality Test
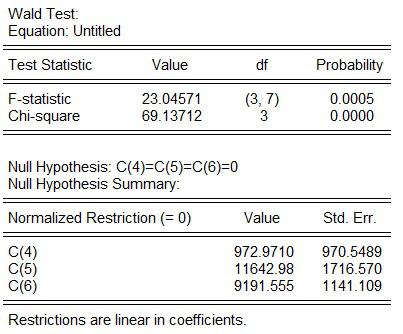
Table 8
Wald Test Results for the Long-Run Granger Causality Test
Some Implications:
- To the extent that falling prices are thought to be a permanent phenomenon, it appears reasonable to argue that they will cause Toyota hybrids to fade in the years ahead.
- This would put into question Toyota's medium- and long-term "green car" business strategy which is pretty much linked to hybrid and fuel cell cars rather than plug-in hybrid and battery electric vehicles. True, a few years back, Toyota introduced the Prius plug-in hybrid and the RAV-4 EV into the market. But production of these models has been discontinued in December 2015 and June 2015, respectively. Following a recent Wall Street Journal article, Toyota now "plans to sell roughly 7 million conventional hybrids world-wide over the next five years" and "at least 30,000 fuel-cell vehicles a year world-wide by around 2020."
- Toyota's inclination toward hybrids has been associated with a preference for nickel over lithium in its advanced energy storage systems (batteries). This line of action is likely to change slightly in the coming years following the introduction of five new Prius models (i.e. TWO Eco, THREE, THREE Touring, FOUR, and FOUR Touring) all equipped with Li-ion batteries in 2016. They will be added to the standard Prius now called TWO, still powered with nickel metal hydride batteries. However, the "new" medium-term strategy may still be a flawed approach as long as Toyota continues to be relying on hybrids and fuel cell vehicles instead of battery electric vehicles. Why? Well, because in times of falling oil prices such as the present one, sales of conventional hybrids are likely to be affected more seriously than those of plug-ins, regardless of whether they're lithium-powered or not. Note that according to hybridcars.com between last year and the year before, only in the U.S., Toyota sold 31,716 fewer hybrids (with nickel metal hydride batteries), whereas other manufacturers retailed 36,032 fewer hybrids (with lithium-ion batteries). The latter number acquires a significant dimension given the fact that in December 2015 Toyota hybrids comprised almost 76% of all hybrid sales in the U.S. These results are in sharp contrast with a modest albeit positive growth (6.6%) of all electric cars between 2014 and 2015 which passed from 67,851 cars to 72,303 vehicles.
- This is in line with a previous contention of mine that going lithium in hybrids may be a short-lived approach, one which may be completely surpassed by another relying on range-extended electric vehicles and all-electric cars (rather than both conventional and plug-in hybrids). Be aware though that not all markets are created equal. In Europe, for instance, where Toyota hybrid sales appeared to have grown 17% last year, falling oil prices didn't mean a great deal probably because, as a Green Car Congress commentator has just argued, "petrol and diesel are still expensive in Europe as so much of the price is tax which does not decline with oil prices." Yet, European consumers do seem to be migrating from hybrids to pure electric cars, which overshadows a seeming success of Toyota hybrids in 2015. In fact, according to PwC, YTD-Sept.-2014 vs. YTD-Sept.-2015 auto data for Europe reflect a 79.6% growth in registrations of pure electric and plug-ins, "followed by hybrids at 21%." As for Japan, the country where most Toyota hybrids have been sold during the last 19 years, it has been extrapolated that between 2014 and 2015 Toyota's Prius sales declined by 59,211 cars (or -31%), which can be compared with a decrease of only 5,453 (or 20%) in plug-in hybrids and BEV sales in YTD-Oct.-2014 vs. YTD Oct.-2015, noting that over 51% (2,828 cars) of that diminution might be explained by discontinuation of the Toyota Prius plug-in hybrid. Lastly, nowhere in the world as in China (where there's no evidence of any hybrid sales) has the growth of electric (plug-ins and all-electric) vehicles been more impressive. Comparative data for 2014 and 2015 show that EV adoption increased by 129,726 cars (or 220%). Needless to say, all of the previous numbers and in particular the Chinese EV leap-frogging experience provides considerable support for my 2009 insight regarding the evolution of electric cars in the world. In this context, three factors have been attributed to for the significant EV growth in recent years: consumer desire for more emission-friendly vehicles, the maturation of pure electric technologies and their positive perception among consumers, and government incentives. Time will tell how events in relation to these factors unfold in the years to come.
- Regarding fuel cell vehicles, it seems too early to conclude that they represent a threat to plug-ins or all-electric cars considering that sales of these cars constitute such a tiny part of the market and the necessary infrastructure is still missing. Recent estimates suggest that Toyota has thus far sold between 375 and 450 fuel cell electric vehicles only, which places some doubts as to whether it will be capable of reaching its target of 30,000 cars per year beginning 2020. Likewise, a recent report by the U.S. Department of Energy (DOE) clearly states that hydrogen infrastructure is still in its early stage of development pinpointing many obstacles that will have to be overcome in order for fuel cell electric vehicles to make a difference in today's increasingly competitive EV market.

Comments
Log in or sign up to join the conversation.