
Conference Board Leading Economic Index: Continued Growth In May
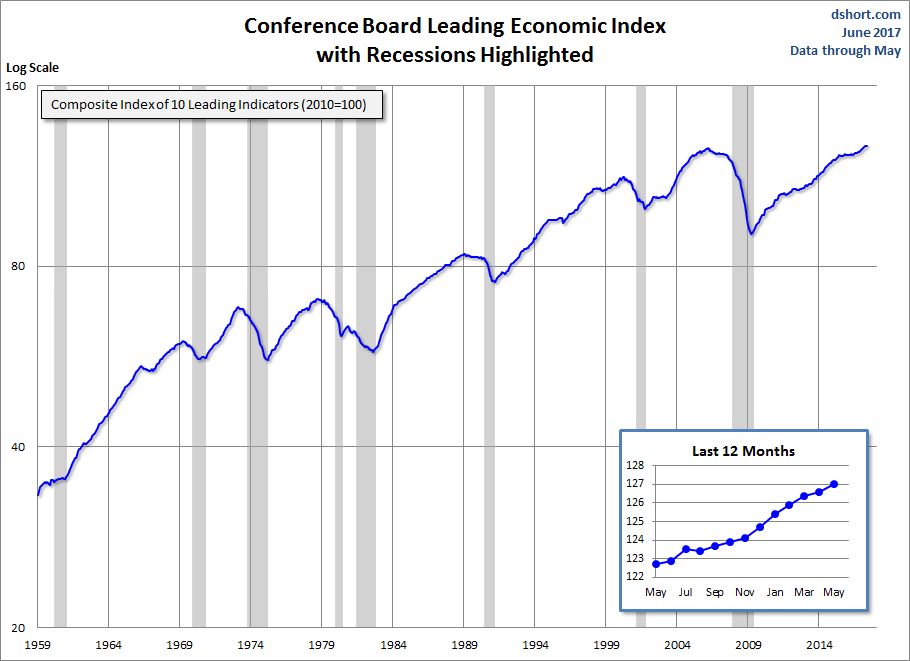
The Latest Conference Board Leading Economic Index (LEI) for May increased to 127.0 from a revised 126.6 in April and is currently at an all-time high. The 0.3 percent month-over-month gain was better than the 0.2% increase forecast by Briefing.com.
The Conference Board LEI for the U.S. continued to increase in May with positive contributions from all of its components except for building permits, which dropped sharply, and weekly manufacturing hours. In the six-month period ending May 2017, the LEI increased 2.3 percent (about a 4.7 percent annual rate), faster than the growth of 1.1 percent (about a 2.3 percent annual rate) during the previous six months. Also, the strengths among the leading indicators have remained more widespread than weaknesses. [Full notes in PDF]
Here is a log-scale chart of the LEI series with documented recessions as identified by the NBER. The use of a log scale gives us a better sense of the relative sizes of peaks and troughs than a more conventional linear scale.
(Click on image to enlarge)
For additional perspective on this indicator, see the latest press release, which includes this overview:
“The U.S. LEI continued on its upward trend in May, suggesting the economy is likely to remain on, or perhaps even moderately above, its long-term trend of about 2 percent growth for the remainder of the year,” said Ataman Ozyildirim, Director of Business Cycles and Growth Research at The Conference Board. “The improvement was widespread among the majority of the leading indicators except for housing permits, which declined again. And, the average workweek in manufacturing has recently shown no sign of improvement.”
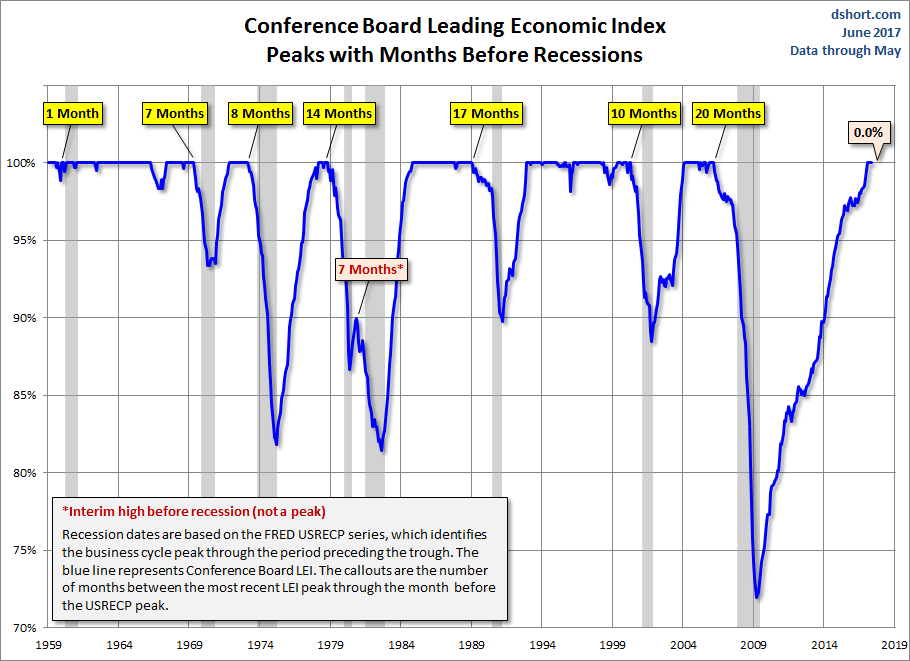
For a better understanding of the relationship between the LEI and recessions, the next chart shows the percentage-off the previous peak for the index and the number of months between the previous peak and official recessions.
(Click on image to enlarge)
LEI and Its Six-Month Smoothed Rate of Change
Based on suggestions from Neile Wolfe of Wells Fargo Advisors, LLC and Dwaine Van Vuuren of RecessionAlert, we can tighten the recession lead times for this indicator by plotting a smoothed six-month rate of change to further enhance our use of the Conference Board's LEI as a gauge of recession risk.
(Click on image to enlarge)

As we can see, the LEI has historically dropped below its six-month moving average anywhere between 2 to 15 months before a recession. The latest reading of this smoothed rate-of-change suggests no near-term recession risk. Here is a twelve month smoothed out version, which further eliminates the whipsaws:
(Click on image to enlarge)

Disclosure: None.


