
Commodities Continue To Dominate Deep-Value ETF Ranking
The slide in global markets in recent weeks has cut prices near and far, but the steepest declines for the trailing five-year return – a proxy for the value factor – are still linked with the dive in commodities. That was true for the deep-value list in October and the profile is intact in today’s update, which reflects trading through yesterday (Nov. 14).
Before we dive into the rankings, let’s review the definition of value for this preliminary hunt for bargains via exchange-traded products. The ranking is based on a five-year annualized return, a trailing period inspired by “Value and Momentum Everywhere,” a 2013 Journal of Finance paper by AQR Capital Management’s Cliff Asness and two co-authors. There are many ways to measure value, but as an initial screen across asset classes and its subsets, there’s a case for starting the review with this metric. Why? It’s easy and facilitates the analysis across a broad range of assets on an apples-to-apples basis.
The pool of assets for this exercise: 135 exchange-traded products that run the gamut: US and foreign stocks, bonds and real estate, along with funds targeting commodities and currencies. (You can find the full list here, sorted in descending order by five-year return through yesterday, Nov. 14). Note that the full playing field becomes quite granular in spots. In equities, for instance, the ETF list ranges from broad regional definitions (Asia, Latin America, etc,) to country funds and down into US sectors (energy, financials, for instance) and industries (e.g., oil & gas equipment & services). The only limitation is what’s available for US exchange-listed funds. Otherwise, the search is broad and deep, or at least as deep as permitted given the current lineup of ETFs.
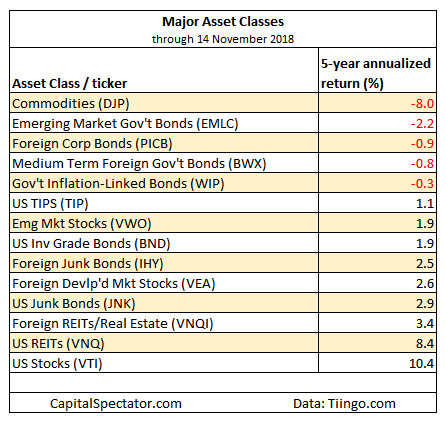
Let’s start by focusing on the major asset classes for a big-picture review. Once again, broadly defined commodities continue to post the steepest five-year loss for this group: iPath Bloomberg Commodity (DJP) is underwater by an annualized -8.0%. The next-steepest loss: VanEck Vectors JP Morgan Emerging Market Local Currency Bond (EMLC), which has lost an annualized 2.2% over the last five years.
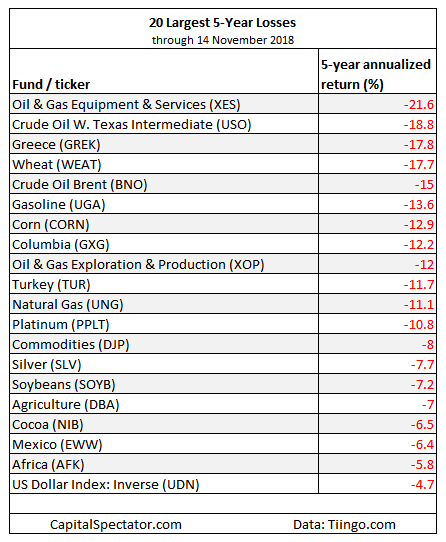
For the full list of funds, the next table shows the 20-deepest losses. It’s still a commodities-heavy field, but note that the biggest five-year setback is now found in stocks in a corner of the energy sector: SPDR S&P Oil & Gas Equipment & Services (XES) is the biggest loser via a 21.6% annualized decline for the trailing five-year run. Crude oil is the second-worst performer: United States Oil (USO) is down an annualized 18.8%.
One final note: the biggest loser in the October ranking, United States Natural Gas (UNG), has since attracted a surge of buyers, soaring 45% since our previous deep-value update on Oct. 9. Par for the course in individual commodities, of course – high volatility, up and down. Nonetheless, the sharp gain reminds that deep-value pricing sometimes signals a bargain that draws a crowd in short order.
Disclosure: None.


