
Commitment Of Traders, Futures In The Near Future, What Hedge Funds Are Doing
Following futures positions of non-commercials are as of July 24, 2018.
10-year note: Currently net short 509.5k, up 40.4k.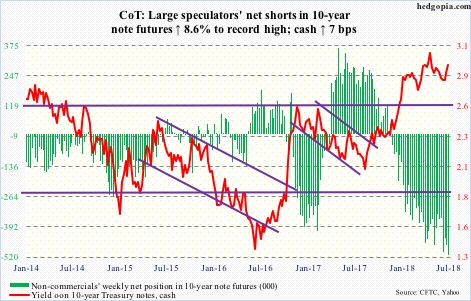
Bond bulls have an opportunity. Remains to be seen if they can cash in on it. The 10-year Treasury yield (2.96 percent) could be forming the right side of a potentially bearish head-and-shoulders formation, should it head back down from current levels. The neckline lies around 2.75 percent.
Non-commercials can play an important role in this regard – possibly. They have built massive net shorts in 10-year note futures. It is at a new record. A squeeze – should one unfold – can act as a self-fulfilling prophecy. As early as last September, the 10-year yielded 2.03 percent.
30-year bond: Currently net long 2.4k, down 14.6k.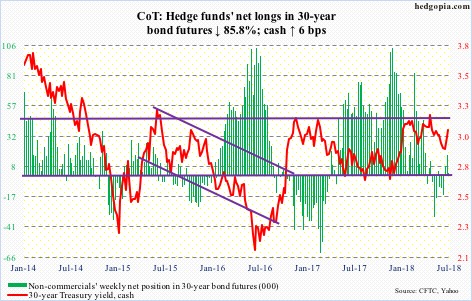
Major economic releases next week are as follows.
Tuesday brings the employment cost index (2Q), personal income and spending (June), and the S&P Case-Shiller home price index (May).
Compensation costs for civilian workers rose 2.7 percent for the 12-month period ending in 1Q18. This was the fastest pace since 3Q08.
Core PCE – the Fed’s favorite measure of consumer inflation – increased 1.96 percent in the 12 months to May. This was the fastest pace of growth since April 2012.
Nationally, home prices increased 6.4 percent on an annual basis. The last time prices fell year-over-year was six years ago.
Also Tuesday, a two-day FOMC meeting begins. This is the year’s fifth. Year-to-date, they moved twice – in March and June – and are not expected to move in next week’s. Futures have priced in 90 percent odds of a 25-basis-point hike in September (25-26). December (18-19) odds are at 68 percent.
The ISM manufacturing index for July comes out Wednesday. June was up 1.5 points month-over-month to 60.2. February’s 60.8 was the highest reading since May 2004.
Thursday, revised durable goods data for June are on deck. Preliminarily, orders for non-defense capital goods ex-aircraft – proxy for business capex plans – rose 8.3 percent y/y.
July’s employment report and the ISM non-manufacturing index for the same month are scheduled for Friday.
Non-farm payroll in June grew 213,000 m/m, for a first-half monthly average of 215,000 – a pace faster than last year’s monthly average of 182,000.
Services activity rose 0.5 points m/m to 59.1. January’s 59.9 was the highest ever (data only goes back to January 2008).
Crude oil: Currently net long 656.8k, down 25.4k.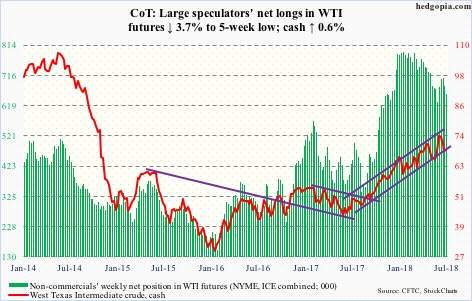
The EIA report for the week of July 20 – out Wednesday – showed stocks fell across the board, with crude down 6.1 million barrels to 404.9 million barrels, gasoline down 2.3 million barrels to 233.5 million barrels and distillates down 101,000 barrels to 121.2 million barrels. Crude imports fell 1.3 million barrels per day to 7.77 mb/d. Crude production was unchanged at 11 mb/d. Capacity utilization fell five-tenths of a percentage point to 93.8 percent.
The report must have helped trader sentiment. Spot West Texas Intermediate crude ($68.69/barrel) began the week with an unsuccessful test of the 50-day moving average. Come Wednesday, it was recaptured but then lost again Friday. This week’s rally followed defense of support at $66-67 last week. Resistance lies at $69-69.50, and it has held thus far.
In a long-legged doji week four weeks ago, WTI reversed lower after hitting an intraday high of $75.27.
E-mini S&P 500: Currently net long 181.9k, down 1.1k.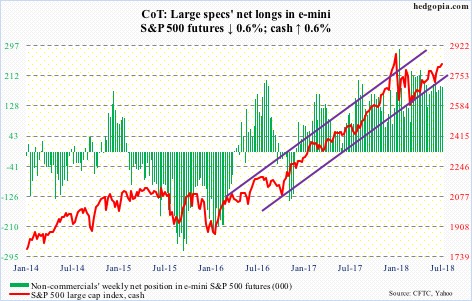
Bulls built on last week’s rectangle breakout at 2800. Wednesday, the cash (2818.82) rallied to within less than 25 points of the all-time high of 2872.87 on January 26. In doing so, it also tested the upper bound of a four-month ascending channel. Most of that session’s gains came in the last half hour as news of a trade truce between the EU and the US hit the wires. The daily chart is way extended. The January 30 gap has been filled. Breakout retest is likely near term. The 50-day lies at 2761.62.
In the week to Wednesday, SPY (SPDR S&P 500 ETF) took in $1.9 billion, VOO (Vanguard S&P 500 ETF) $364 million, while IVV (iShares core S&P 500 ETF) lost $478 million (courtesy of ETF.com). In the same week, US-based equity funds (including ETFs) lost $620 million (courtesy of Lipper.com). This was the seventh weekly outflows in last eight, during which $44.9 billion was withdrawn.
Euro: Currently net long 29.6k, up 8.2k.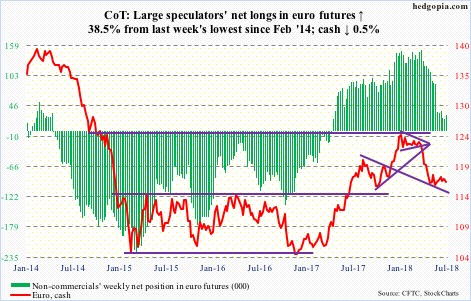
Resistance at $117.40-ish proved tough on the cash ($116.61). Thursday, post-governing council meeting, Mario Draghi, ECB president, did not help. Market participants were probably hoping for more clarity on the plan laid out in June. None came. The ECB does not intend to raise the deposit rate (currently minus 0.4 percent) until at least next summer. The monthly asset purchases (currently €30 billion/month) will unwind at the end of the year.
The daily lower Bollinger band – successfully tested Friday – lies at $116.16, which approximates trend-line support from May 29, when the euro fell to an intraday low of $115.19. Support at $114-115 is a must-hold. After going sideways in a rectangle for nearly two and a half years, the euro broke out of this level last July.
Gold: Currently net long 48.6k, down 9.2k.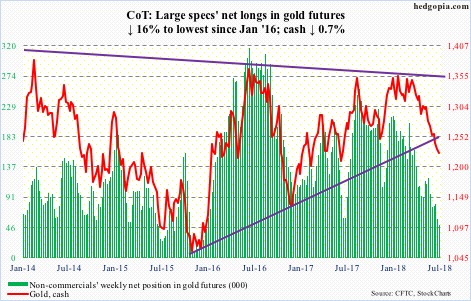
For a change, in the week through Wednesday GLD (SPDR gold ETF) attracted $244 million. This followed 11 out of 12 straight weeks of outflows totaling $3.1 billion. IAU (iShares gold trust), however, continued to bleed, down $46 million and down $1.2 billion in the last 10 weeks straight (courtesy of ETF.com).
Last week, the cash ($1,223/ounce) lost a trend line from December 2015, dropping to an intraday low of $1,210.70. The metal has tried to stabilize since, with $1,235 the nearest roadblock.
Nasdaq 100 index (mini): Currently net long 32.9k, down 6.3k.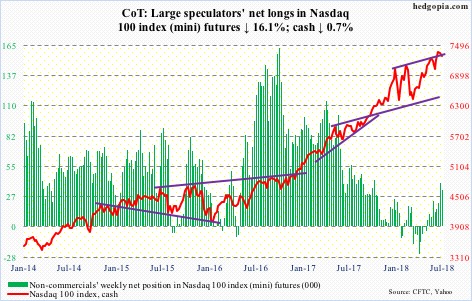
In the week ended Wednesday, QQQ (PowerShares QQQ ETF) experienced outflows in every session, with combined loss of $1.6 billion (courtesy of ETF.com). The cash (7296.78) in the meantime rallied to yet another high on Wednesday (7511.39), once again testing the upper bound of a six-month ascending channel.
During the week, of the major tech names, Facebook (FB) and Intel (INTC) disappointed, while Alphabet (GOOGL) and Amazon (AMZN) received positive post-earnings reaction, although AMZN closed poorly. The Nasdaq 100 continues to be led by a very narrow group of leaders. With daily momentum indicators having turned lower, the index closed the week right at near-term support of 7300. Medium term, it needs to go a lot lower before overbought conditions are unwound.
Russell 2000 mini-index: Currently net long 25.8k, down 15.3k.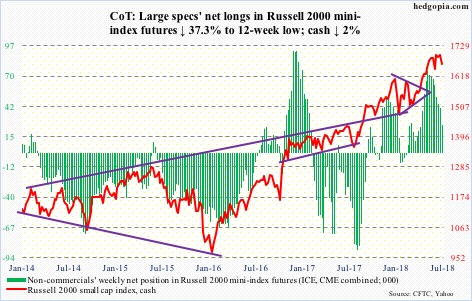
Bulls yet again tested 1700-plus on the cash (1663.34), and met with failure – 1708.10 on June 20, 1708.56 on July 10 and 1706.83 this Tuesday. This sideways action follows a break out of 1610-15 mid-May, hence can be viewed as consolidation before another leg higher. But non-commercials have not been betting on this outcome.
The weekly chart in particular remains way overbought. Friday, the 50-day was slightly breached. Breakout retest is the path of least resistance.
In the week to Wednesday, IWM (iShares Russell 2000 ETF) saw withdrawals of $916 million. This is the fifth straight week of redemptions, having lost $1.5 billion in the prior four. IJR (iShares core S&P small-cap ETF) in the same week gained $334 million (courtesy of ETF.com).
US Dollar Index: Currently net long 25.3k, up 6.3k.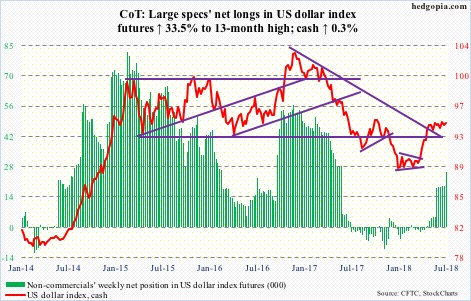
Since May 14, the cash (94.46) has made higher lows. Shortly thereafter, 95-plus posed resistance. So in essence, the US dollar index is in the midst of an ascending triangle. A breakout will be significant. This is probably why dollar bulls have not given up. In three of the first four sessions this week, the 50-day was lost intraday but saved by close.
That said, non-commercials are not betting on a massive breakout. At least not yet. Prior to this week, net longs went flat in the 18,000 range for five weeks. This week, they added more, but have not gotten very aggressive. They are probably eyeing the weekly chart on the cash which remains grossly overbought.
VIX: Currently net short 86.2k, up 14.3k.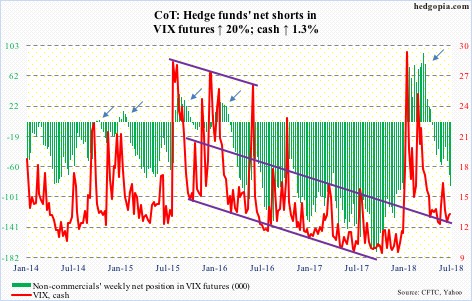
For over seven weeks, volatility bears tried to push the cash (13.03) sub-11, but unsuccessfully. Unlike in the past when VIX routinely dropped to 10 – even high single digits (all-time low of 8.56 last November) – it has found support at a higher level since stocks sold off late January-early February. Unless broken, this is a trend shift. The only thing is, attempts to push off of this support have met with selling, with 19-plus resisting rally attempts several times the past three months. Friday, VIX was unable to take out the 200-day. But in all probability a breakout is coming.
In the meantime, the 21-day moving average of the CBOE equity-only put-to-call ratio continued to inch higher, with Friday at 0.623. This metric has thus far diverged from the S&P 500. On June 26, it dropped to 0.56, which is low and reflects built-in optimism. One reason behind this is that protection is being sought even as stocks are rallying. Put skew is positive, and elevated.
Disclaimer: This article is not intended to be, nor shall it be construed as, investment advice. Neither the information nor any opinion expressed here constitutes an offer to buy or sell any ...
more

