Close Of 2018 Q1 Draws Near On Accelerating Volatility
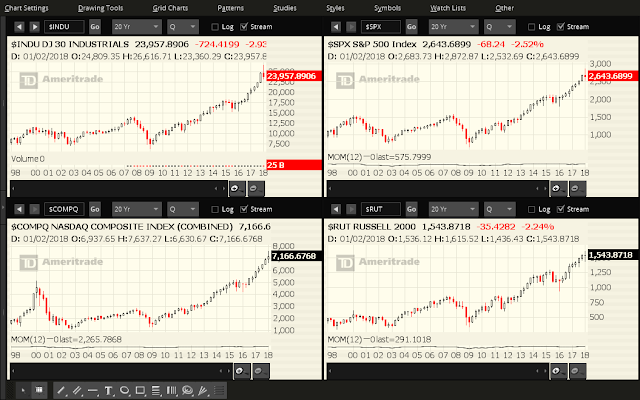
Each candle on the following charts of the Dow 30, S&P 500, Nasdaq Composite, and Russell 2000 Indices represents a period of one quarter of one year.
This year's Q1 candle is a high-wave spinning top, representing indecision. It will close next Friday.
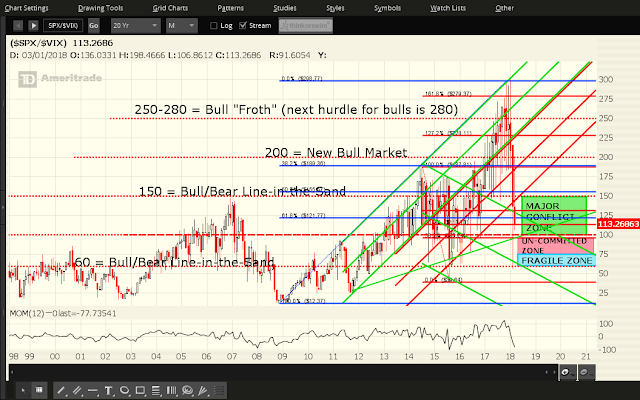
After today's broad-based equity drop, the SPX:VIX ratio has extended its decline, closing well below the 150 Bull/Bear line-in-the-sand level, and is mired in the "major conflict zone," as shown on the monthly ratio chart below. Momentum is accelerating to the downside and is well below its zero level.
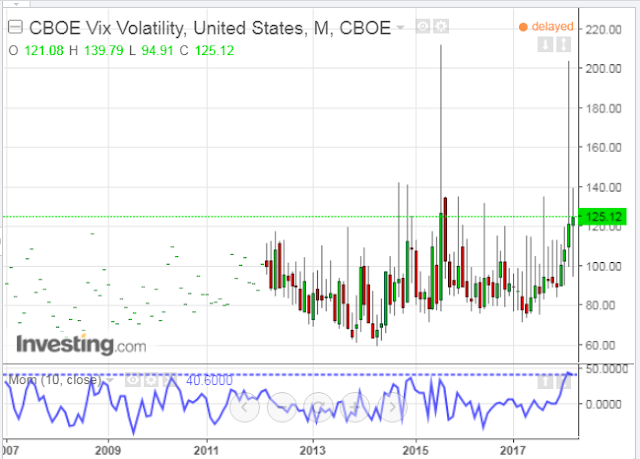
The following monthly chart of the CBOE VIX Volatility Index (VVIX) shows that momentum of VIX volatility closed on an all-time high last month, forecasting rising volatility of equity volatility and risk. Where it closes next Friday may provide a hint as to acceleration or deceleration of further equity decline in the month(s) ahead.
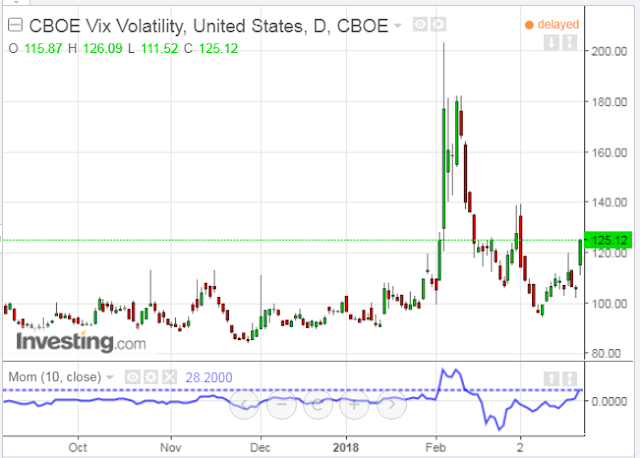
In this regard, the next chart of the VVIX shows that momentum is accelerating on a daily timeframe, is well above the zero level, and is making a series of higher swing highs and lows. Watch for that to continue next month in order to confirm the sustainability of any further increase in VIX volatility.
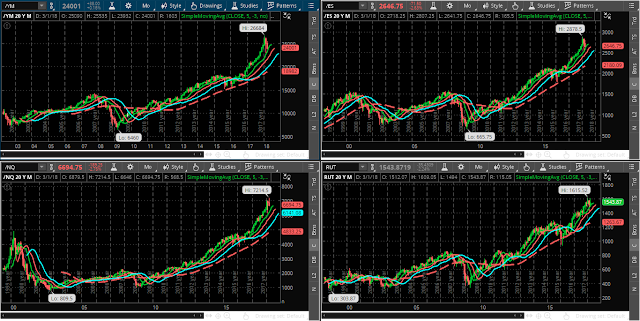
Finally, the following monthly charts of the Dow 30, S&P 500 & Nasdaq 100 E-mini Futures Indicesplus the Russell 2000 Index show that price is hovering above a moving average "Alligator" formation. If price falls inside this formation, we'll see high volatility and wild swings remain, with, possibly a further correction in equities, until it breaks out and holds above this beast. Unless we see a very sharp snap-back soon in these indices (in the next week or two), I'd say that higher volatility will continue for awhile.