
Charts Of The Day – Natural Gas
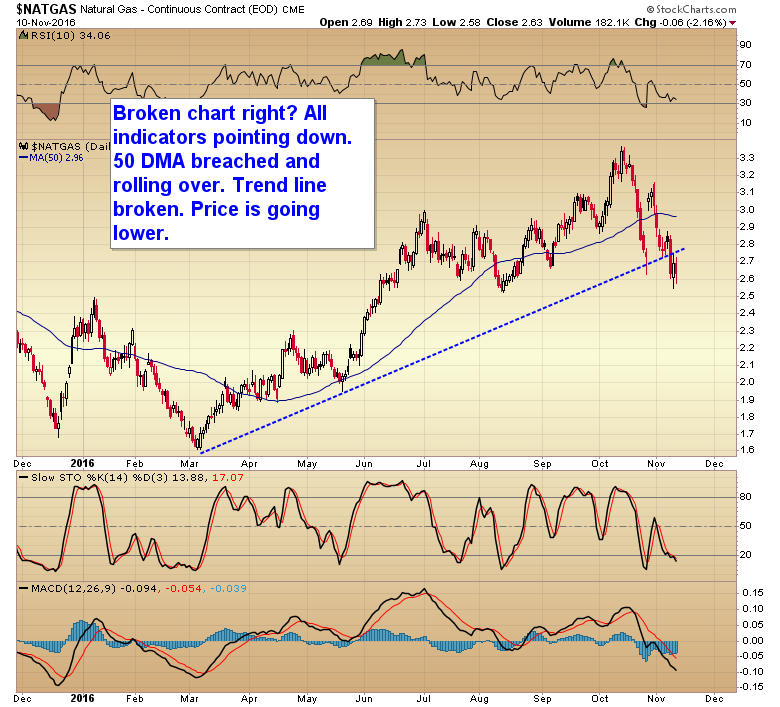
Broken chart right? All indicators pointing down. 50 DMA breached and rolling over. Trend line broken . Price is going lower.
Disclosure: None.
How did you like this article? Let us know so we can better customize your reading experience.

Comments
Leave a comment to automatically be entered into
our contest to win a free Echo Show.

