Thursday, December 1, 2016 1:06 PM EDT
Say it with me - Fresh breakouts AFTER a market has been running have a higher degree of failure. One look at the NASDAQ Comp. here and you can clearly see this.
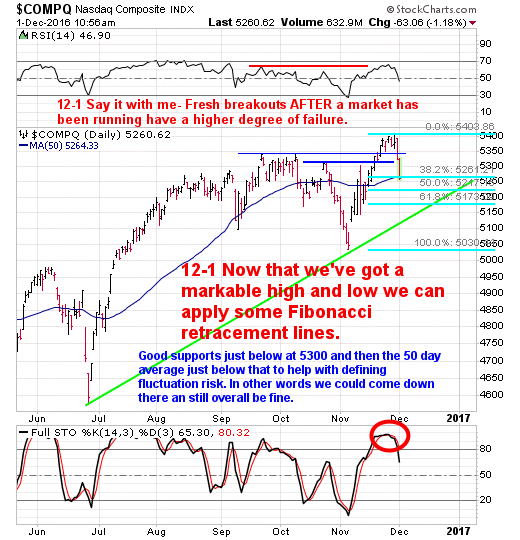
So now what? For that let's talk Fibonacci retracements. As you can see we are fast approaching the 38.2% Fib zone which also just happens to be the 50 day average. If that doesn't stick? Then there is the 50% and 61.8%. Remember, Fibonacci retracements can and often do act as support zones. At this point it's just a matter of which one is going to call the ball and truly act as support. If none of the most common Fib zones stick then the big green uptrend line could be in play.
You can also see that when one looks at the RSI above the chart and the Full Stohcastics below the chart they aren't quite to the oversold territory as of yet which means that we still could have a bit more downside before all said and done.
So what does one do? Sit back and watch for stabilization while having a list of names so that when a turn around shows up you are ready in advance vs having to chase them AFTER they really start to move. Just look at all the past selloffs in the chart above and see what ultimately they all led to, just an observation folks.
Makes one wonder if this isn't a setting up the pins so as to bowl for strikes for a Santa rally into the holiday.
Take care, have a great rest of the week.
Disclosure: None.
Disclaimer: THESE ARE NOT BUY RECOMMENDATIONS! Comments contained in the body of this ...
more
Disclosure: None.
Disclaimer: THESE ARE NOT BUY RECOMMENDATIONS! Comments contained in the body of this report are technical opinions only. The material herein has been obtained from sources believed to be reliable and accurate, however, its accuracy and completeness cannot be guaranteed. Amazing Power Patterns reserves the right to refuse service to anyone at anytime for any reason. Amazing Power Patterns is not an investment advisor, hence it does not endorse or recommend any securities or other investments. Any recommendation contained in this report may not be suitable for all investors and it is not to be deemed an offer or solicitation on our part with respect to the purchase or sale of any securities. All trademarks, service marks and trade names appearing in this report are the property of their respective owners, and are likewise used for identification purposes only. The member/subscriber agrees that he/she alone bears complete responsibility for his/her own investment/trading decisions. Amazing Power Patterns.com and all affiliates shall not be liable to anyone for any loss, injury or damage resulting from the use of any information. Trade at you're own risk, this information is strictly for educational and informational purposes only. Amazing Power Patterns.com and all affiliates assumes NO responsibility whatsoever for any losses experienced by anyone who uses its educational materials to make financial decisions. All charts courtesy of stockcharts.com
Want to know more? Visit our website. Have you enjoyed good results from our newsletter or have a comment or question? Contact us at customercare@amazingpatterns.com We'd love to hear from you. If you enjoy these newsletters, tell a friend!
less
How did you like this article? Let us know so we can better customize your reading experience.


