
Calling A Pull Back On The Spy
- SPX Monitoring purposes; Covered short SPX 1/31/17 at 2278.87 =.09% gain; Short on 1/30/17 at 2280.90
- Monitoring purposes Gold: Sold GDX at 24.33 on 2/22/07 = gain 20.15%; Long GDX on 12/28/16 at 20.25.
- Long Term Trend monitor purposes: Short SPX on 1/13/16 at 1890.28

High volume days are usually tested and March 1 had very high volume and the higher the volume means it has more resistance when tested. Last week was option expiration week which has a 67% of being higher (which it was) and if it was higher than the week after has a 70% being lower. If market pushes to the March 1 high, and volume is less, then a sell signal may develop at the March 1 high. Still neutral for now.
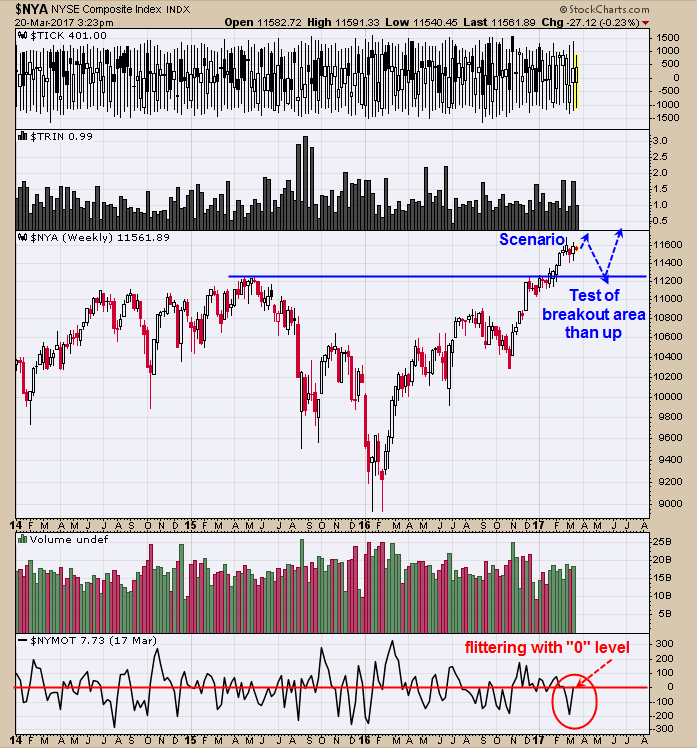
Above is the weekly NYSE (NYA) chart. In late February NYA broke above the 2015 highs near 11200 and at some point that breakout area will be tested. A Buying Climax occurred March 1 on the SPY near 2400 range and most likely will be tested first before the potential pull back starts. The bottom window is the McClellan Oscillator which is be flittering with the “0” level the last few days showing weakness. The reason we calling a pull back on the SPY near 227 range is that is where the NYA corresponding price support of 11200 lies. Being patience for now.
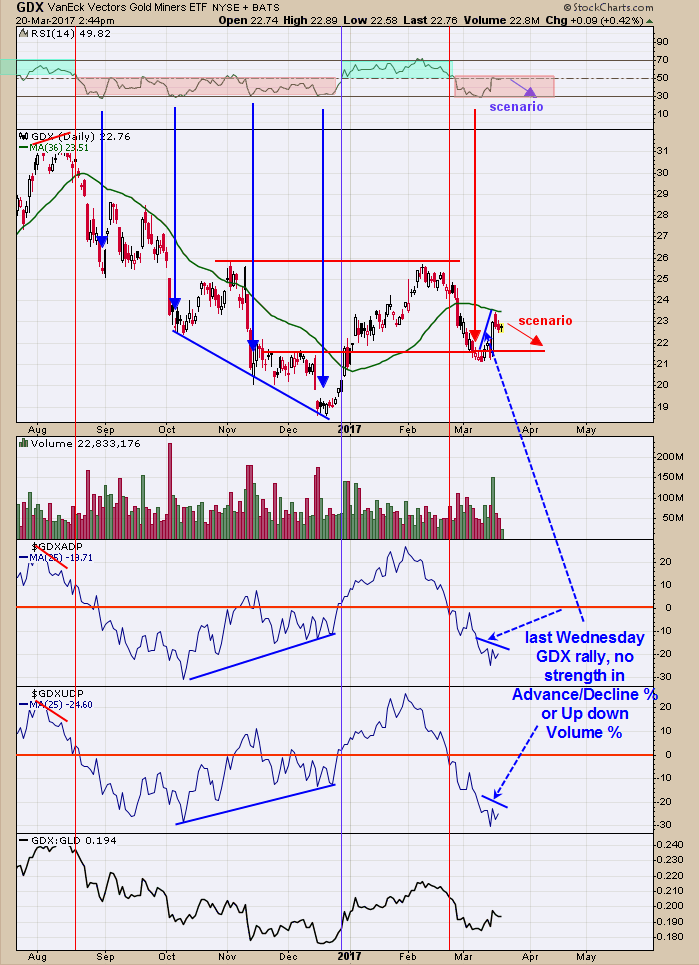
The second window up from the bottom is the Up down Volume percent (Friday’s close) which did not respond to last week rally in GDX and a negative divergence. A close above “0” on this indicator is needed for it to turn bullish and as you can see it a long way from turning positive. Next window up is the Advance/Decline percent (Friday’s close) which also did not respond to last weeks rally in GDX a negative divergence. A close above “0” on this indicator would be a bullish sign and as you can see its a long way from “0”. At previous lows in GDX both the advance/Decline % and Up down volume % produced positive divergences and that is not what is happening here. The timing for the next buy signal could come around Tax time near April 15 and possible near the 21 range on GDX. Timer Digest has us ranked #1 in performance for gold over the last 12 months. Sold GDX at 24.33 on 2/22/17 = gain 20.15%; Long GDX on 12/28/16 at 20.25.


