
Blaming The Fed For Weaker Greenback
Although the Federal Reserve raised interest rates yesterday, the forecast for two more hikes this year (instead of three) disappointed market participants who turned their backs on the U.S. dollar, triggering quite sharp selloff. But did anything really change in the technical picture of the greenback?
Before we analyze our currency pairs, let’s check what changed (and what has not changed) in the short-term picture of the USD Index after yesterday’s news.
USD Index in Focus
(Click on image to enlarge)
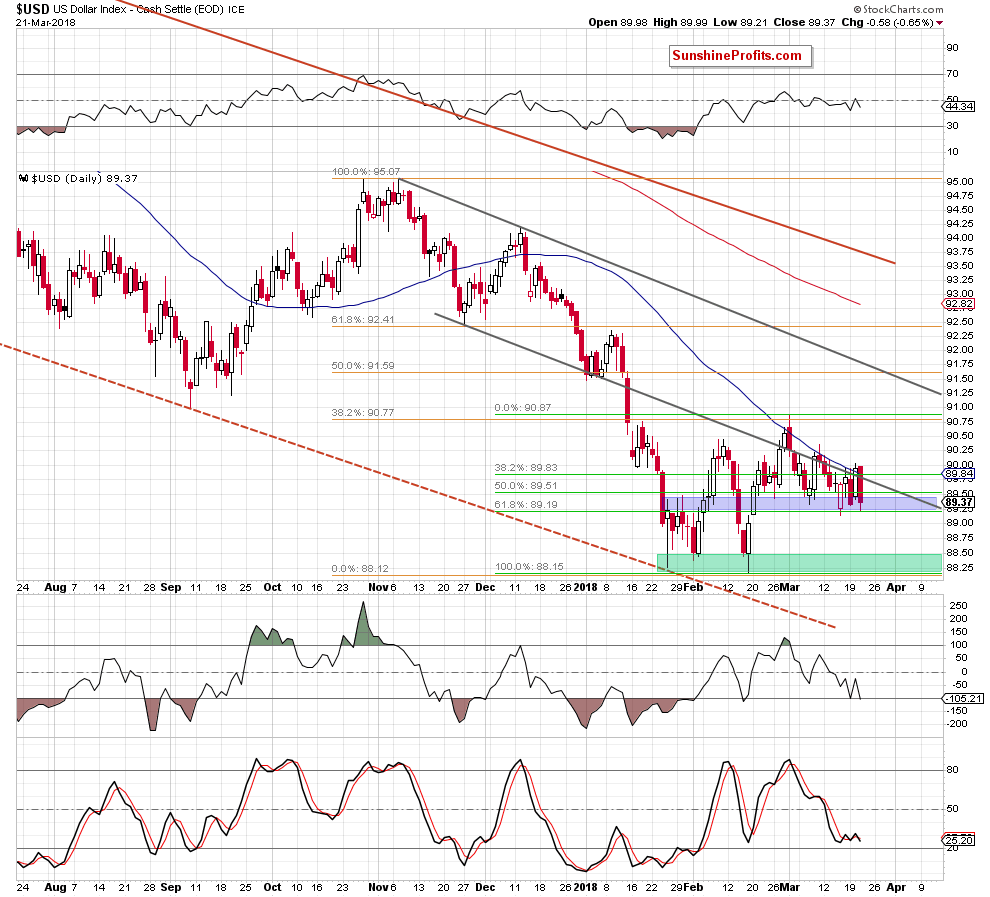
Looking at the daily chart, we see that the USD Index bounced off the blue support zone in the previous week and closed Tuesday’s session above the previously-broken lower border of the black declining trend channel and the 50-day moving average.
Although this was a positive event, we were a bit skeptical about this improvement, because this was nothing more than what we already saw in the previous weeks. When we take a closer look at the daily chart, we see that very similar situation took place at the end of February and also at the beginning of March. In both previous cases, the index didn’t climb above the moving average, but yesterday’s price action clearly shows that history repeated itself once again despite this tiny improvement.
So, what’s next for the USD Index? Taking all the above into account and combining it with the fact that the blue support zone continues to keep declines in check, we believe that what we wrote in our Forex Trading Alert a week ago is up-to-date also today:
(…) the USD Index stuck between the support zone and the resistance line.
Since the beginning of the month, the index is trading in a narrow range between the lower border of the black declining trend channel and the blue support zone based on the late January highs, late February lows and two Fibonacci retracements (the 50% and 61.8%). This means that as long as there is no breakout above the March peak or a breakdown under the blue zone another bigger move is not likely to be seen and short-lived moves in both directions should not surprise us.
However, what could happen if we see a breakout or a breakdown?
Let’s consider both scenarios.
If currency bulls win, and the index climbs above the March peak, we’ll see an upward move to the upper border of the black declining trend channel (…) in the following days. Such price action would likely translate into a test of the early January highs in EUR/USD.
On the other hand, if currency bears push the index under the blue support zone, we’ll see a re-test of the green support zone created not only by the January and February lows, but also by the 50% and 61.8% Fibonacci retracements (we wrote about this area in our article posted on February 23, 2018).
Having said the above, let’s examine the current situation in EUR/USD and AUD/USD.
EUR/USD
(Click on image to enlarge)
Yesterday, we wrote the following:
(…) taking into account the current position of the daily indicators (they suggest that the euro will extend gains against the greenback) and uncertainty around today’s Federal Reserve's monthly policy decision, we decided not to open short positions.
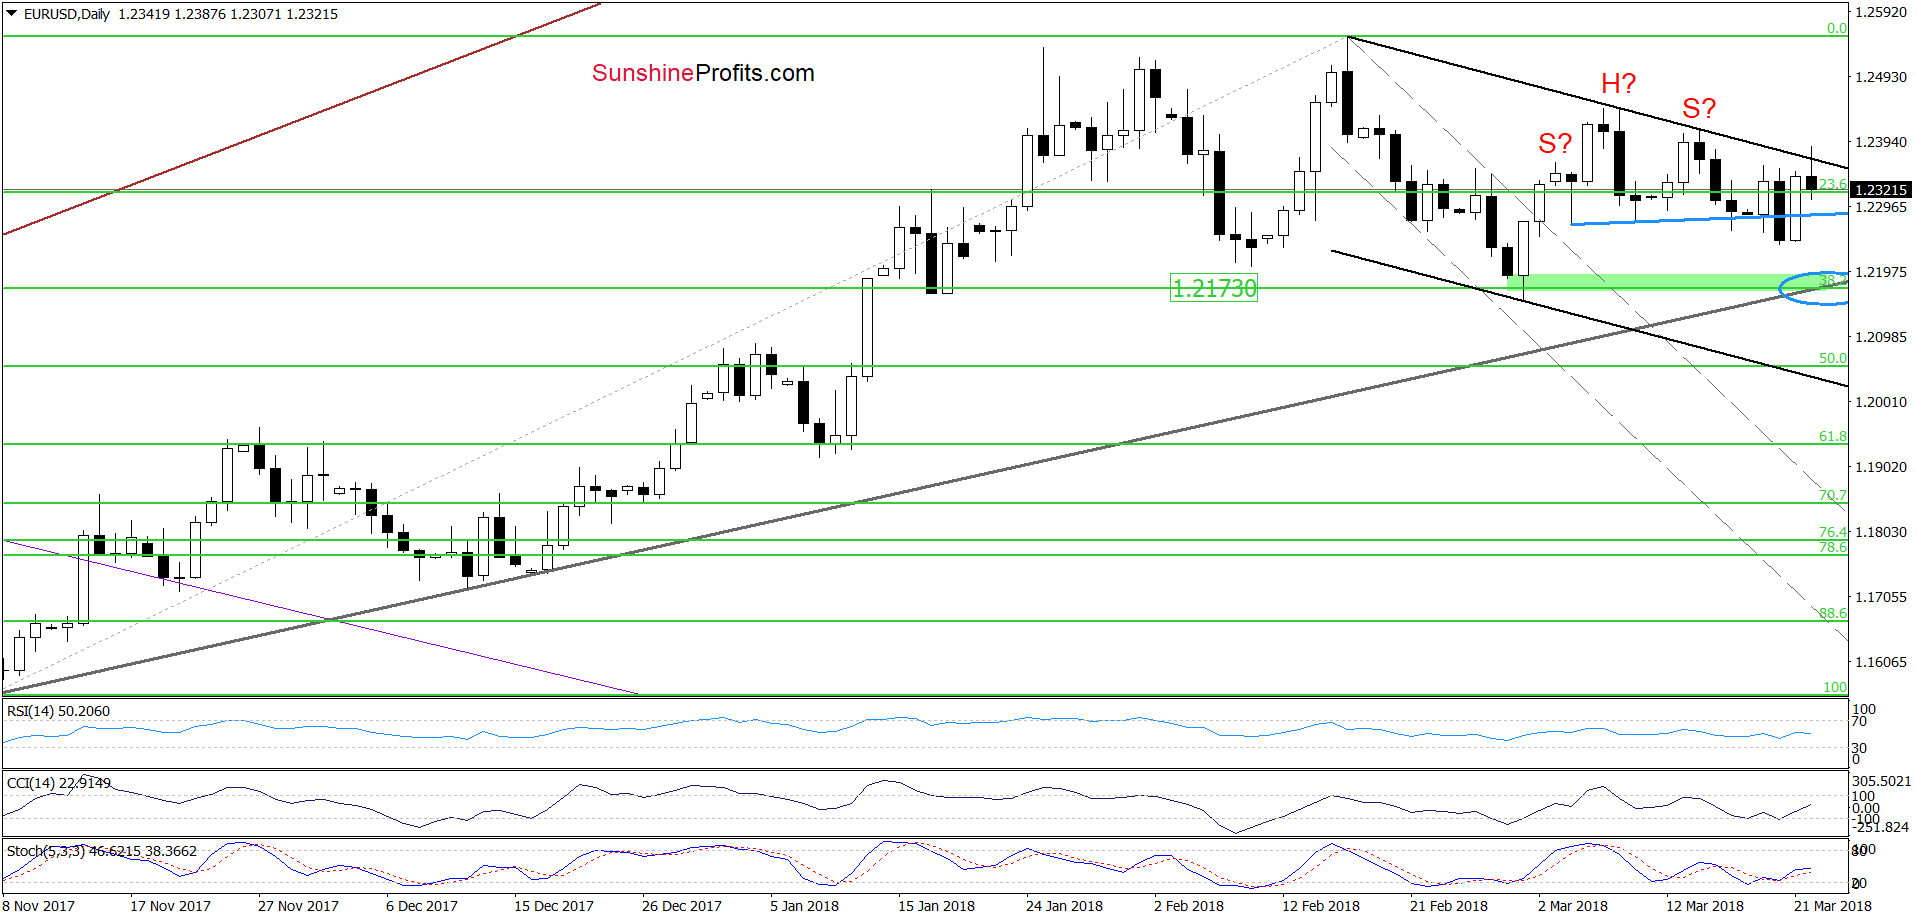
From today’s point of view, we see that yesterday’s decision was a good choice as EUR/USD bounced off session’s low and invalidated the earlier breakdown under the blue support line (the neck line of the head and shoulders formation). Thanks to this improvement the exchange rate came back to the north and re-tested the strength of the black declining resistance line based on the previous highs.
As you see, this nearest resistance stopped the buyers, triggering a pullback and an invalidation of the tiny breakout earlier today. This is a negative event, which suggests a drop to the blue line or even a decline to the green support zone (created by the 38.2% Fibonacci retracement and the March low and reinforced by the medium-term black rising support line based on the November and December lows) in the following days.
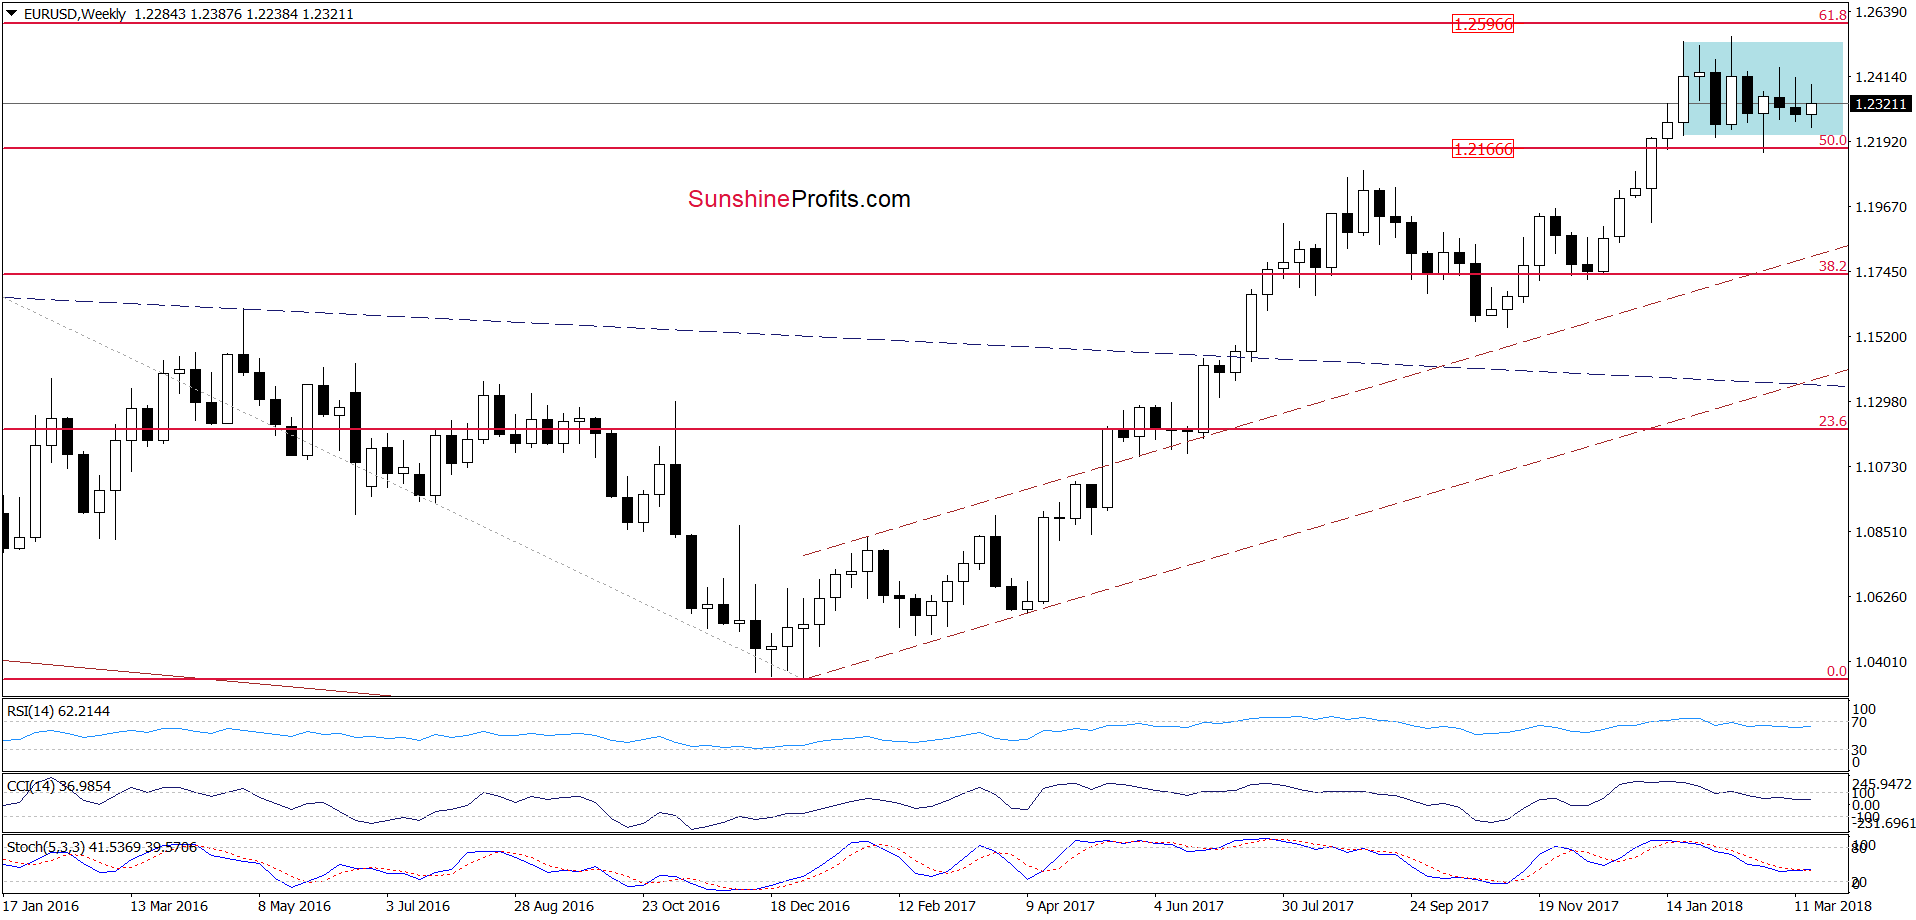
Nevertheless, as long as there is no breakdown below these supports (and the breakout above the March peak in the USD Index), a bigger move to the downside is not likely to be seen – specially when we factor in the fact that EUR/USD is still trading in the blue consolidation seen on the weekly chart below.
(Click on image to enlarge)
AUD/USD
(Click on image to enlarge)
In our last commentary on this currency pair, we wrote the following:
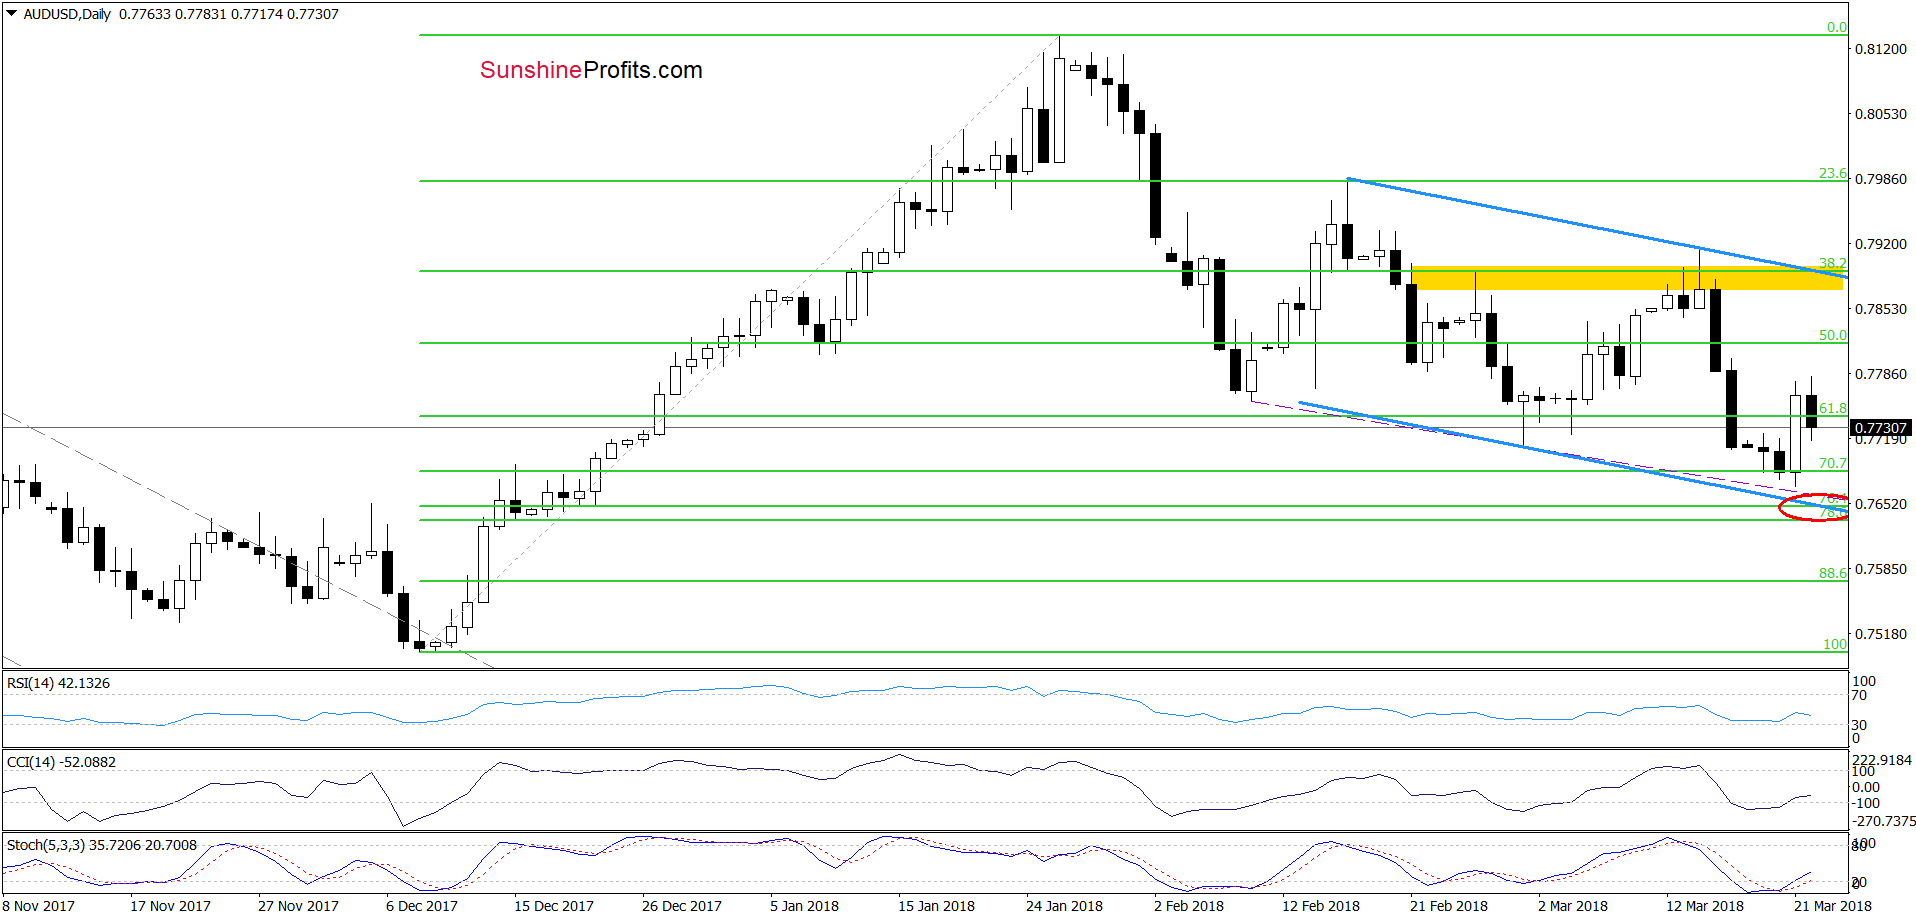
(…) currency bulls tried to push the pair higher yesterday, but their efforts failed, and their opponents created a candle with an elongated upper shadow, which (…) in combination with the sell signals generated by the indicators (…) suggests that we’ll see (…) declines from here (…)
Looking at the daily chart, we see that the situation developed in tune with our assumptions and AUD/USD moved sharply lower, reaching the 70.7% Fibonacci retracement and approaching the lower border of the blue declining trend channel yesterday.
Although this support area encouraged currency bulls to act, resulting in a quite sharp rebound on Wednesday, the pair reversed earlier today, which suggests that a re-test of the last low (or even a drop to the support area created by the 76.4%, 78.6% Fibonacci retracements and the lower line of the blue trend channel) can’t be ruled out.
This scenario is also reinforced by the above-mentioned current situation in the USD Index as the greenback reached the blue support zone once again, which suggests another rebound in the following day(s).


