
BEA Estimates 3rd Quarter 2018 GDP Growth At 3.49%
In their first ("preliminary") estimate of the US GDP for the third quarter of 2018, the Bureau of Economic Analysis (BEA) reported that the US economy was growing at a +3.49% annual rate, down -0.67% from the prior quarter.
The minor change in the headline number masks significant and worrisome turmoil in the details. In fact, the BEA's "bottom line" measurement of the economy (the "real final sales of domestic product") collapsed, dropping nearly four percent (-3.91%) from the prior quarter.
The red ink relative to the last report is substantial: commercial fixed investment is now contracting (at a -0.04% annualized rate, and down -1.14% from the prior quarter), exports are also now contracting (at a -0.45% rate, down -1.57% from the prior quarter), and imports are now removing -1.34% from the headline number (down -1.44% from the prior quarter).
It could be argued that the headline number has been propped up by the most fickle of the BEA's data items: inventories; which added +3.24% more to the headline than they did during the prior quarter.
In contrast, the consumer sector was steady (with the growth in goods and services spending up +0.11% in total from the prior quarter), as was governmental spending -- adding +0.13% more to the headline than during the prior quarter.
Household disposable income was reported to be up by $180 per annum, and the household savings rate dropped only slightly from the prior quarter to 6.4%.
For this revision, the BEA assumed an effective annualized deflator of 1.39%. During the same quarter (July 2018 through September 2018) the inflation recorded by the Bureau of Labor Statistics (BLS) in their CPI-U index was somewhat higher at 1.83%. Underestimating inflation results in optimistic growth rates, and if the BEA's "nominal" data was deflated using CPI-U inflation information the headline growth number would have been lower at a +3.11% annualized growth rate.
Among the notable items in the report :
-- The headline contribution from consumer expenditures for goods was +1.20%, up +0.04% from the prior quarter.
-- The contribution to the headline from consumer spending on services was +1.49%, up +0.07% from last quarter. The combined consumer contribution to the headline number was +2.69%.
-- Commercial private fixed investments contracted, subtracting -0.04% from the headline number. This was down -1.14% from the prior quarter.
-- Inventories boosted the headline number by +2.01%, up +3.24% from the prior quarter. It is important to remember that the BEA's inventory numbers are exceptionally noisy (and susceptible to significant distortions/anomalies caused by commodity price or currency swings) while ultimately representing a zero reverting (and long term essentially zero sum) series.
-- The growth in governmental spending was up, adding +0.56% to the headline number (and up +0.13% from the prior quarter).
-- Exports crashed, subtracting -0.45% from the headline number, down -1.57% from the prior quarter.
-- Imports returned to normal form, subtracting -1.34% from the headline number (down -1.44% from the prior quarter). In aggregate, foreign trade impacted the headline number by -1.79%.
-- The "real final sales of domestic product" growth dropped -3.91% to +1.42%. This is the BEA's "bottom line" measurement of the economy and it excludes the inventory data.
-- As mentioned above, real per-capita annual disposable was reported to have grown $180 per annum from the prior quarter. The household savings rate was reported to be 6.4% (down -0.4% from the prior quarter).
The Numbers
As a quick reminder, the classic definition of the GDP can be summarized with the following equation:
GDP = private consumption + gross private investment + government spending + (exports - imports)
or, as it is commonly expressed in algebraic shorthand:
GDP = C + I + G + (X-M)
In the new report the values for that equation (total dollars, percentage of the total GDP, and contribution to the final percentage growth number) are as follows:
GDP Components Table
| Total GDP | = | C | + | I | + | G | + | (X-M) | |
|---|---|---|---|---|---|---|---|---|---|
| Annual $ (trillions) | $20.7 | = | $14.1 | + | $3.7 | + | $3.6 | + | $-0.6 |
| % of GDP | 100.00% | = | 68.09% | + | 17.84% | + | 17.19% | + | -3.13% |
| Contribution to GDP Growth % | 3.49% | = | 2.69% | + | 2.03% | + | 0.56% | + | -1.79% |
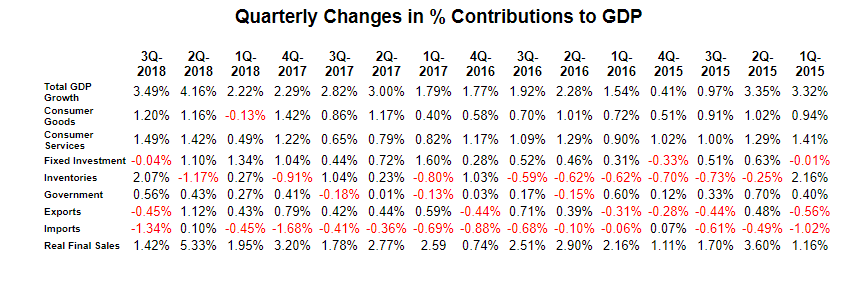
The quarter-to-quarter changes in the contributions that various components make to the overall GDP can be best understood from the table below, which breaks out the component contributions in more detail and over time. In the table below we have split the "C" component into goods and services, split the "I" component into fixed investment and inventories, separated exports from imports, added a line for the BEA's "Real Final Sales of Domestic Product" and listed the quarters in columns with the most current to the left:
Summary and Commentary
After last quarter's happy news, this report is somewhat sobering. The headline still looks good, but a wild swing in inventories has masked material deterioration in private fixed investments (in both commercial and residential construction) and foreign trade.
Households, on the other hand, seem to be doing better -- as evidenced by steady consumer spending on both goods and services.
This report is very different from the good news and solid numbers reported for the second quarter of 2018. 3Q-2018 certainly looks more like an economy in transition than what was reported for 2Q-2018. And we are always a little nervous when inventory growth is providing more than half of the headline number.
Disclosure: None.


