
AUD/USD Rate Holds Narrow Range Ahead Of U.S. GDP, Australia CPI
AUD/USD clings to the monthly range ahead of key data prints coming out of the U.S. and Australia, but the diverging paths for monetary policy continues to cast a long-term bearish outlook for the exchange rate as both price and the Relative Strength Index (RSI) preserve the bearish trends from earlier this year.
AUD/USD RATE HOLDS NARROW RANGE AHEAD OF U.S. GDP, AUSTRALIA CPI

The recent weakness in AUD/USD appears to have fizzled ahead of the monthly-low (0.7041) as the exchange rate holds a narrow range, and the updates to the U.S. Gross Domestic Product (GDP) report may keep aussie-dollar afloat as the growth rate is projected to increase 3.3% after expand 4.2% per annum in the second-quarter of 2018.
A lackluster development may rattle the U.S. dollar as it dampens the outlook for growth and inflation, but the data print may do little to derail the Federal Open Market Committee (FOMC) from its hiking-cycle as the central bank large achieves its dual mandate for monetary policy.
In turn, the U.S. GDP print may spark a limited reaction, and market participants may end up paying increased attention to Australia’s Consumer Price Index (CPI) as the headline reading is expected to narrow to 2.0% from 2.1% in the second quarter. Signs of subdued price growth is likely to keep the Reserve Bank of Australia (RBA) on the sidelines, and it seems as though Governor Philip Lowe & Co. will carry the record-low cash rate into 2019 as ‘there was no strong case for a near-term adjustment in monetary policy’.
With that said, the RBA may continue to tame bets for higher borrowing costs at its next meeting on November 6, and the diverging paths for monetary policy may generate increased volatility in the exchange rate along with a further shift in retail sentiment.
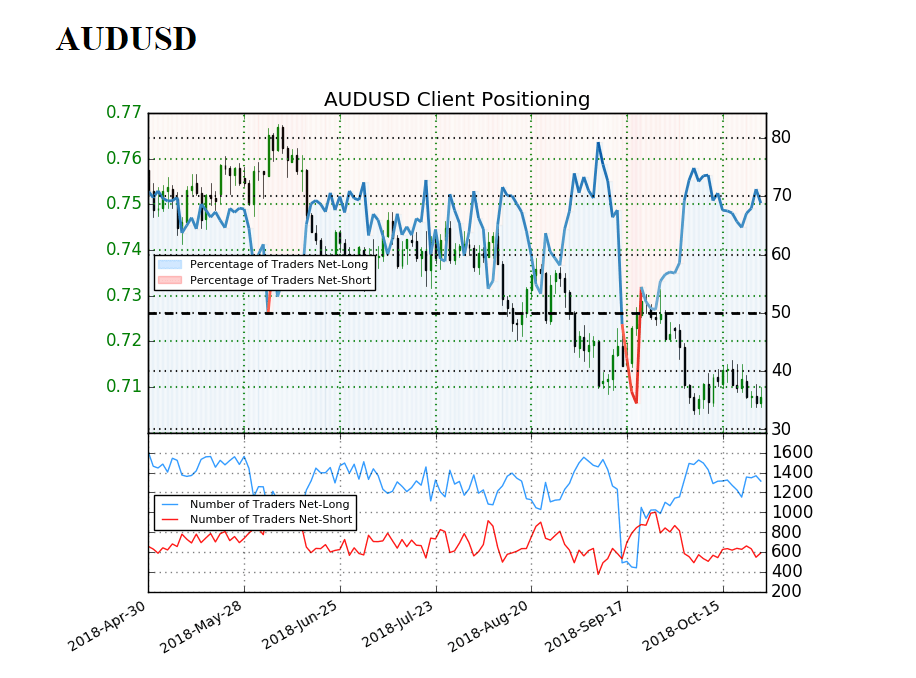
The IG Client Sentiment Report shows retail interest still near extremes as 68.8% of traders are net-long AUD/USD, with the ratio of traders long to short at 2.21 to 1. In fact, traders have remained net-long since September 24 when AUD/USD traded near 0.7270 even though price has moved 2.8% lower since then. The number of traders net-long is 1.4% lower than yesterday and 5.1% higher from last week, while the number of traders net-short is 6.7% lower than yesterday and 11.3% lower from last week.
The persistent skew in retail interest continues to offer a contrarian view to crowd sentiment, with the broader outlook for AUD/USD still tilted to the downside as both price and the Relative Strength Index (RSI) track the bearish formations from earlier this year.
AUD/USD DAILY CHART
(Click on image to enlarge)
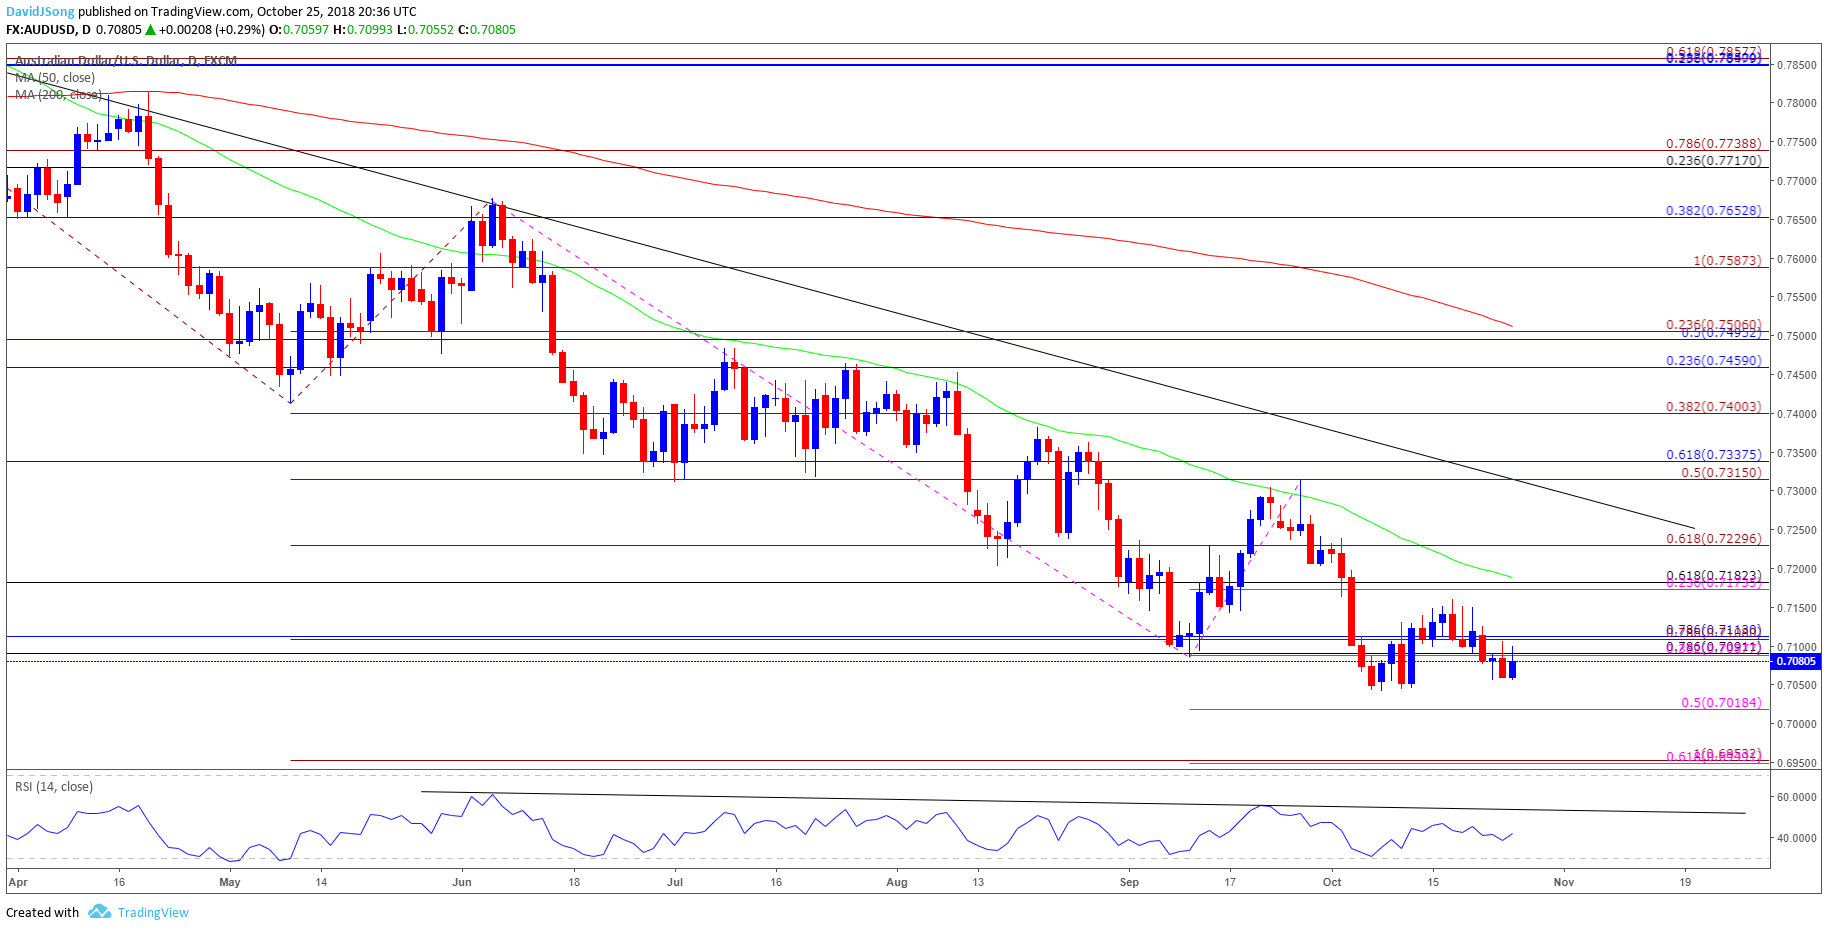
- The near-term outlook for AUD/USD remains mired by the failed attempt to get back above the 0.7090 (78.6% retracement) to 0.7110 (78.6% retracement) region, with the recent series of lower highs raising the risk for further losses.
- In turn, the 2018-low (0.7041) remains on the radar, with the next downside region of interest coming in around 0.7020 (50% expansion) followed by the 0.6950 (61.8% expansion) area.
Disclosure: Do you want to see how retail traders are currently trading the US Dollar? Check out our IG Client Sentiment ...
more

