
Apple Inc. After Disappointing Revenue Results
Rotten Apple? Apple Posts Disappointing Results
Apple Inc. (AAPL) is engaged in designing, manufacturing and marketing mobile communication and media devices, personal computers, and portable digital music players. The Company's products and services include iPhone, iPad, Mac, iPod, Apple TV, a portfolio of consumer and professional software applications, the iOS and Mac OS X operating systems, iCloud, and a range of accessory, service and support offerings. It sells its products worldwide through its online stores, its retail stores, its direct sales force, third-party wholesalers, and resellers. Apple Inc. is headquartered in Cupertino, California.
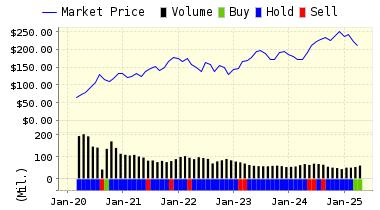
Apple posted disappointing results Tuesday after the close, and the market has reacted in a negative fashion. The company posted revenues of $75.87 billion, which was below consensus estimates--$76.6 billion. Earnings per share increased to $3.28/share up from the $3.06/share posted last year--and they beat estimates of $3.23/share here. Net income also increased, to $18.36 billion--a boost of almost 2%.
However, while these numbers represent growth, they do not show the sort of explosive climb analysts and investors have grown to expect from Apple. And once you dig into the numbers, there is reason for concern. The all important iPhone numbers were similarly disappointing, with the sales growth essentially flat--growth was less than 1%. Mac computer and iPad sales provided no solace, and were down year-over-year.
While the company reported higher sales to China than elsewhere, those numbers were also down when compared to the past fiscal year. Apple noted that sales were harmed in foreign markets--which are hugely important to the company--due to the stronger US dollar.
Luca Maestri, Apple CFO, noted that "record sales and strong margins drove all-time records for net income and EPS in spite of a very difficult macroeconomic environment." Tim Cook, the CEO, also noted the tough global environment and said earnings were impacted by "extreme conditions unlike anything we've experienced before just about anywhere we look."
The shares declined in aftermarket trading Tuesday, and since then they are down even more. As expected, the relatively bad news from Apple hurt the market yesterday as those results--along with bad reports from Boeing, served to further fuel doubts about the health of the global economy.
Of course, this stock is a powerhouse. It will take a while for changes in guidance, analysts estimates, and share price fluctuations to work their way through our systems. For now we continue the BUY recommendation on APPLE INC. Based on the information we have gathered and our resulting research, we feel that APPLE INC has the probability to OUTPERFORM average market performance for the next year. The company exhibits ATTRACTIVE Company Size and Sharpe Ratio.
|
ValuEngine Forecast |
||
|
Target |
Expected |
|
|---|---|---|
|
1-Month |
100.56 | 0.57% |
|
3-Month |
102.43 | 2.44% |
|
6-Month |
103.63 | 3.64% |
|
1-Year |
106.82 | 6.83% |
|
2-Year |
108.82 | 8.83% |
|
3-Year |
113.64 | 13.65% |
|
Valuation & Rankings |
|||
|
Valuation |
12.22% undervalued |
Valuation Rank |
|
|
1-M Forecast Return |
0.57% |
1-M Forecast Return Rank |
|
|
12-M Return |
-11.59% |
Momentum Rank |
|
|
Sharpe Ratio |
0.68 |
Sharpe Ratio Rank |
|
|
5-Y Avg Annual Return |
16.52% |
5-Y Avg Annual Rtn Rank |
|
|
Volatility |
24.32% |
Volatility Rank |
|
|
Expected EPS Growth |
1.49% |
EPS Growth Rank |
|
|
Market Cap (billions) |
582.42 |
Size Rank |
|
|
Trailing P/E Ratio |
10.67 |
Trailing P/E Rank |
|
|
Forward P/E Ratio |
10.51 |
Forward P/E Ratio Rank |
|
|
PEG Ratio |
7.14 |
PEG Ratio Rank |
|
|
Price/Sales |
2.49 |
Price/Sales Rank |
|
|
Market/Book |
5.28 |
Market/Book Rank |
|
|
Beta |
0.89 |
Beta Rank |
|
|
Alpha |
-0.04 |
Alpha Rank |
|
ValuEngine Market Overview
|
Summary of VE Stock Universe |
|
|
Stocks Undervalued |
76.28% |
|
Stocks Overvalued |
23.72% |
|
Stocks Undervalued by 20% |
43.51% |
|
Stocks Overvalued by 20% |
7.31% |
ValuEngine Sector Overview
|
Sector |
Change |
MTD |
YTD |
Valuation |
Last 12-MReturn |
P/E Ratio |
|
Consumer Staples |
-0.83% |
-5.94% |
-5.94% |
3.00% undervalued |
-7.37% |
22.03 |
|
Utilities |
-1.71% |
-6.82% |
-6.82% |
5.83% undervalued |
-15.02% |
21.05 |
|
Computer and Technology |
-1.63% |
-9.06% |
-7.76% |
9.68% undervalued |
-11.70% |
26.68 |
|
Business Services |
-1.33% |
-8.04% |
-8.04% |
10.39% undervalued |
-14.94% |
21.86 |
|
Aerospace |
-0.80% |
-8.46% |
-8.46% |
10.59% undervalued |
-13.64% |
18.44 |
|
Finance |
-1.73% |
-9.52% |
-9.52% |
13.17% undervalued |
-10.97% |
14.59 |
|
Multi-Sector Conglomerates |
-1.51% |
-10.38% |
-10.38% |
13.24% undervalued |
-22.55% |
15.30 |
|
Medical |
-1.17% |
-11.61% |
-11.61% |
14.74% undervalued |
-16.35% |
26.23 |
|
Consumer Discretionary |
-1.31% |
-8.61% |
-8.61% |
15.18% undervalued |
-12.41% |
22.03 |
|
Retail-Wholesale |
-1.36% |
-8.22% |
-8.22% |
16.28% undervalued |
-18.37% |
21.49 |
|
Industrial Products |
-2.12% |
-10.53% |
-10.53% |
16.75% undervalued |
-16.63% |
16.13 |
|
Construction |
-2.07% |
-11.23% |
-11.23% |
24.60% undervalued |
-18.18% |
16.89 |
|
Basic Materials |
-1.78% |
-12.48% |
-12.50% |
25.52% undervalued |
-31.66% |
20.40 |
|
Auto-Tires-Trucks |
-2.54% |
-13.17% |
-13.17% |
25.85% undervalued |
-23.61% |
10.74 |
|
Oils-Energy |
-4.00% |
-16.59% |
-16.59% |
28.60% undervalued |
-43.51% |
19.84 |
|
Transportation |
-1.97% |
-12.62% |
-12.62% |
28.87% undervalued |
-33.68% |
11.99 |
Disclosure: None.
Disclaimer: ValuEngine.com is an independent research provider, producing buy/hold/sell recommendations, ...
more

