
Analyzing Risk-Managed Funds With R
Morningstar tells us that efforts at taming volatility in a multi-asset class framework generally turns up mixed results among publicly traded funds. Studying 60 products that are labeled “multiasset volatility-protection funds,” a recent Morningstar article reports that “as a group, volatility-protection funds do generally offer refuge when equity markets turn negative.” But it’s debatable if the extra cost and complexity that tends to define this group is worthwhile. As Morningstar notes, a simple blended index of 40% equities/60% bonds, which can be created with low-cost index funds, delivered superior downside risk management during periods when the S&P 500 fell.
Generalizing, however, has limits and so it’s best to review funds individually. Although it’s not clear that the group overall has been successful in delivering on its risk-management mandate, some funds do better than others. In fact, Morningstar points out that a handful of products do a reasonable job of managing volatility. Let’s focus on one as an excuse to fire up R and run some basic risk analytics.
For our test, we’ll zero in on Blackrock Global Allocation (MDLOX), one of three “volatility-protection funds in which we have the most confidence.” But we need a benchmark. Let’s use Vanguard STAR (VGSTX), a plain-vanilla multi-asset class fund of funds that’s quasi-passive, low cost, and boasts a respectable track record.
What follows is hardly a definitive effort at analyzing risk; at best, it’s just a toy example. In fact, you should probably start your research in such matters by looking to existing data services for insight, if only as a baseline if you go deeper. Morningstar, as usual, is on the short list as a first step. But if you’re inclined to add an additional level of customized research, R’s powerful and varied toolkit is a solid resource. Let’s dip our toes into the possibilities (you can find the code here for generating the data and charts below).
Let’s start by comparing MDLOX and VGSTX on some basic metrics using daily returns for 1996 through yesterday, Sep. 22, 2016. As the table below shows, MDLOX has a slight edge over VGSTX from a risk-managed perspective. MDLOX’s Sharpe ratio, for instance, is modestly higher, which suggests that the fund’s slightly higher absolute return is in fact superior after adjusting for volatility. Then again, the two sets of numbers below are close enough to suggest that MDLOX’s edge may be an artifact of the sample period.

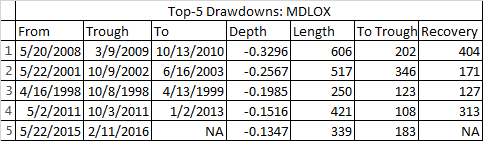
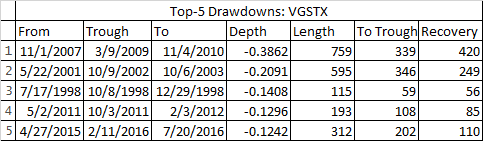
Perhaps we can parse this a bit deeper with drawdowns. But the results are mixed. MDLOX’s deepest drawdown was moderately smaller than VGSTX’s biggest slide, but the Vanguard fund’s drawdowns are lighter otherwise.
Now let’s compare the funds in terms of their shortfall risk, which is a statistical estimate of the probability that a strategy, fund, or asset will fall short of a particular benchmark, return, or risk level. For details, see my post here. As for MDLOX and VGSTX, let’s estimate the probability (based on historical data for the sample period) that each fund will suffer a negative one-year return. In the case of MDLOX, the probability of seeing a negative one-year return is about 23.2%–virtually identical to VGSTX’s 23.1% probability.
Finally, let’s compare the funds through a value-at-risk (VaR) prism. VaR tells us the best-case scenario for tail risk. In other words, this is the estimate for the minimum worst-case loss. VaR tends to underestimate the potential for losses so let’s also look at a variation on this metric that factors in the possibility that returns aren’t normally distributed—so-called modified VaR.
In the first graph, modified VaR at the 99th percentile tells us that MDLOX’s daily return loss approaches 3%.

By comparison, VGSTX’s modified VaR estimate is a touch lower and reaches the 3%-daily-loss mark.
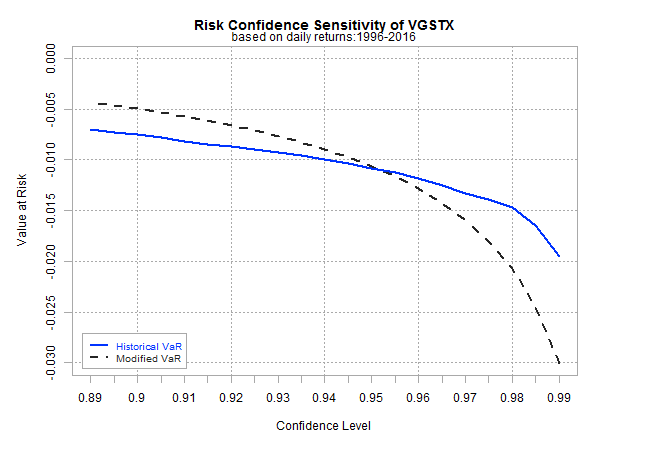
Even the modified VaR data underestimates the potential for tail risk–historical results for the sample period show that daily losses for the funds are around 6%. Whatever the true downside risk for the portfolios, it’s still useful to see how they compare. It appears that the dark side of performance on a daily basis is comparable and so it’s not obvious that MDLOX has a decisive advantage over VGSTX, or so modified VaR suggests.
The analysis above leaves room for doubt about MDLOX’s risk-management capabilities relative to the quasi-passive strategy with VGSTX. But it’s not obvious that MDLOX has failed either, which suggests that a deeper round of analysis is recommended. That’s an encouraging sign when you consider that most efforts at managing risk tend to deliver mediocre results at best and it’s obvious when we crunch the numbers. By contrast, MDLOX appears mildly successfully, which is more than you can say for most funds that are operating in the risk-managed niche.
Disclosure: None.


