
All The Leaves Are Brown And The Data’s Gray
Making Sense:
Humans are funny creatures. When faced with all kinds of evidence to the contrary, humans tend to cling onto what is familiar, to what they have been taught or to their ideological viewpoints. The ability of humans to deny reality is amazing. Even when the evidence makes denial nearly impossible, humans lean on their last crutch, mean reversion. This is especially true of the financial industry. In our industry, it is not enough to be accurate. It is not even enough to be optimistic. One must be optimistic in a way which calls for a return to familiar conditions. Humans will wait and wait and wait, until either the law of averages brings around a return of the mean or until a scapegoat can be found. The problem is, when the world transitions from one era to another, mean reversion becomes problematic, if not impossible. In such a scenario, it is the “clingers” who often end up as the scapegoat.
Denial: It is not a river, but it can drown you
Oil, not your father’s commodity: For the last 50 years, oil has been mainly dominated by one cartel, OPEC. When OPEC cut production, oil prices increased. When OPEC increased production, oil prices fell. OPEC was the swing producer as there were no large-scale alternatives. Since OPEC is comprised of nations with national energy policies, the global price of oil was, more or less, centrally planned. Yes, oil trades freely in the commodities market, but its trading baselines were set by a cabal of foreign governments dictating supply.
North American oil production changed all that. Yes, North Sea and other global oil sources have existed for decades, but individually they paled in comparison with OPEC production, were uncoordinated and production was also set by governments via national energy policies. North American crude oil production changed all that. In the new era of oil, North American oil production is set by the private sector. Fixed costs, debt service and profit motive (at the company/investor level) drive production in North America. Unlike other OPEC alternatives in the past, North American production has the capacity to become the so-called swing producer.
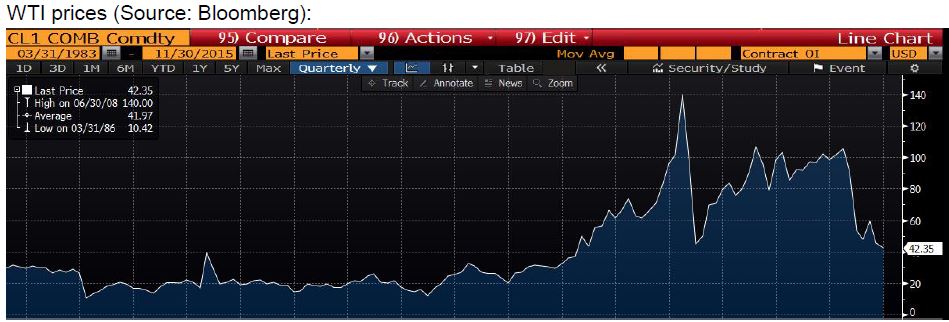
I would remind readers that, except for the global oil shocks of the 1970s, the First Gulf War and the era of “Peak Oil,” WTI crude oil prices tended to trade below $40 per barrel. A price in the neighborhood of $20 per barrel was more common.
(Click on image to enlarge)
Babies and Bathwater: Buying dips, in nearly any asset class, has been a viable strategy for the past six years. However, buyers of energy stocks and junk bonds have caught many falling knives in 2015. Investors and advisors are being reminded that plunging prices are not always due to irrational pessimism and market inefficiencies. In my opinion, given the global supply vs. demand dynamics for commodities, much of the negativity among commodities producers is justified. I do think there are babies among the proverbial bathwater, but if the negativity persists and/or worsens, the health of even the better capitalized sector participants could be compromised. As such, I suggest that investors who wish to speculate among commodity companies to do so (if suitable) via bonds rather than stocks.
Today we have the Fed contemplating tightening more than six years into an expansion. If this was a typical economic cycle (which it clearly is not), the Fed would be tightening in the bottom of the ninth inning (possibly with two outs). This time, the Fed is considering tightening in the bottom of the seventh or top of the eight. Thus, the expansion might have another year, two or three to go. However because the Fed traditionally begins tightening sometime in the third inning and that due to disinflationary winds blowing in from around the world (for a variety of reasons), the majority of the long-term interest rate rise we are likely to see may have already occurred (if one measures from the current expansion low of 1.388% in July 2012). When the 10-year UST note yield reached 3.0% in September and December 2013, that might have marked the policy cycle peak.
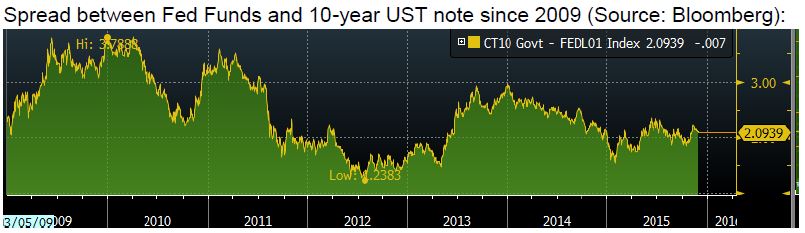
Yes, the spread between Fed Funds and the 10-year UST note yield was at its widest in late 2009, but the easing cycle did not peak until the launch of QE in September 2012. The curve had been flattening for about a year by that time as the economy sputtered (causing the Fed to engage in more QE). The curve steepened in the summer of 2013 as the Fed began to talk taper.
All the leaves are brown and the data’s gray
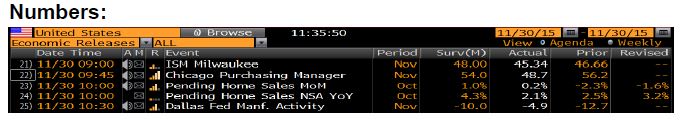
Today’s economic data was disappointing. ISM Milwaukee data indicated that manufacturing activity contracted in November, printing at 45.34 versus a prior 46.66 and a Street consensus of 48.00. The Chicago Purchasing Manager Report fell into contraction territory, printing at 48.7 versus a prior 56.2 and a Street consensus of 54.0. Prints below 50 indicate contraction.
Ever Clear
The fixed income markets are focused on Thursday’s ECB decision and Friday’s employment data. I would be shocked if the ECB didn’t at least extend the time period for QE, if not announce an immediate increase in the scope of its monetary policy accommodation.
I expect a healthy payrolls report on Friday.


