
ADRs Best & Worst Report - August 10, 2015
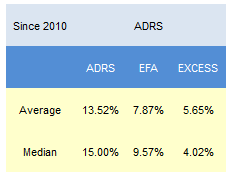
Since 2010, the top scoring stocks in our ADR report each week have outpaced the SPX by a median 402 bps in the following year. Since 2010, the top scoring stocks in our ADR report each week have outpaced the SPX by a median 402 bps in the following year.
The average score across our ADR universe is 48.45 and that is above both the four and eight week average scores of 48.21 and 46.94, respectively. The average ADR is trading -25.4% below its 52 week high, -5.41% below its 200 dma, has 4.15 days to cover held short, and is expected to grow its EPS by 13.1% in the coming year.
Click on picture to enlarge
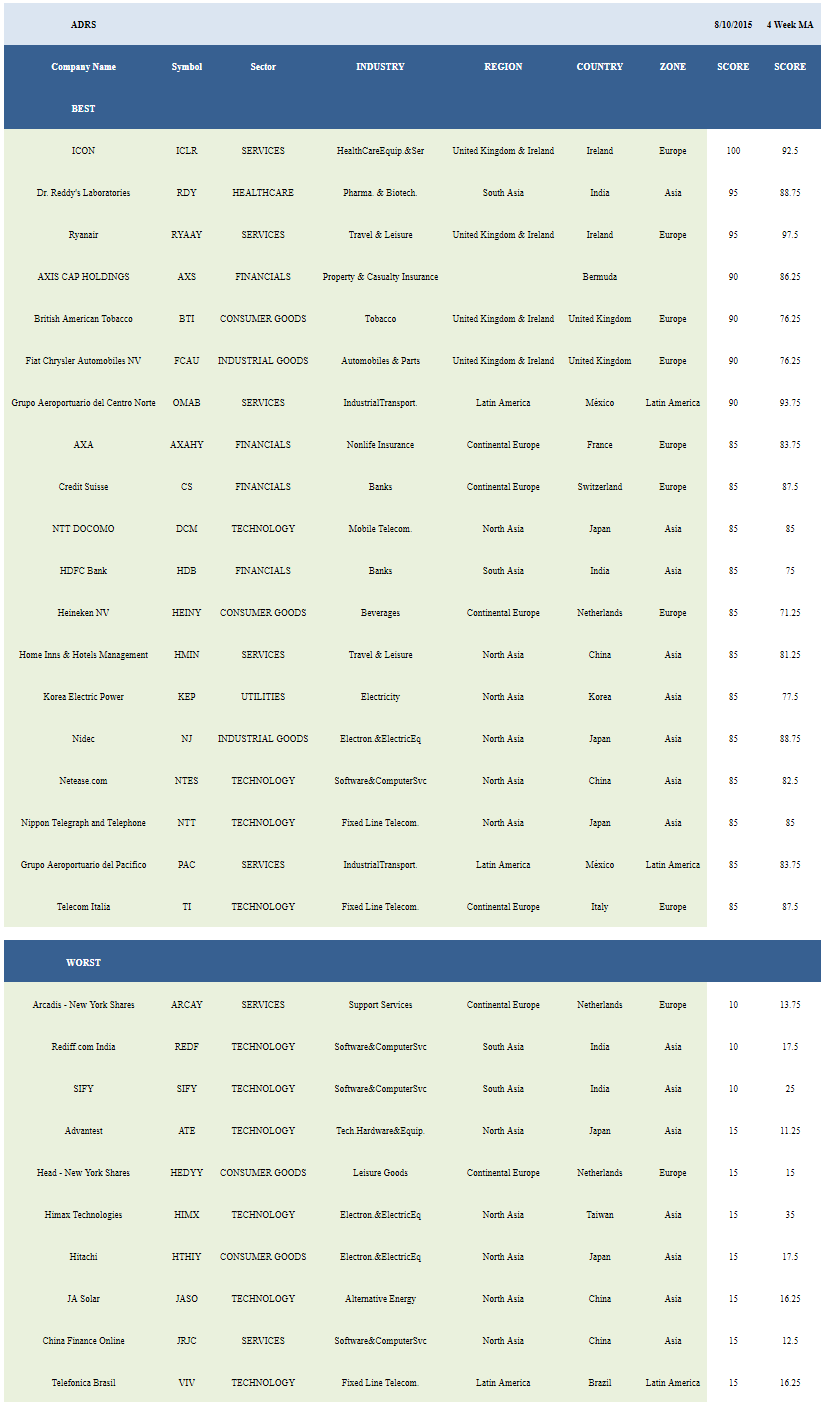
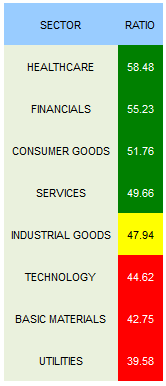
The top healthcare sector is healthcare (RDY, TEVA, NVO, LUX, AMRN, WX, SNY). Portfolios can also be overweight financials (AXS, HDB, CS, AXAHY, RY, BCS, QIWI, ING, NOAH, BMO), consumer goods (BTI, HEINY, ITYBY, IBA, HMC, GMK), and services (ICLR, RYAAY, OMAB, PAC, HMIN, CTRP, WNS, BSYBF). Industrial goods score in line. Technology, basics, and utilities score below average.
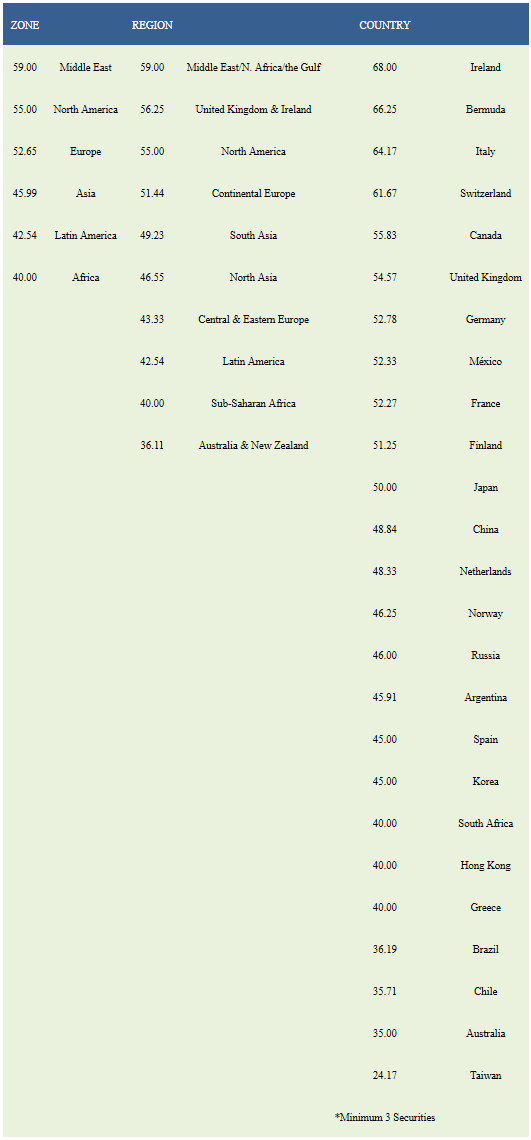
The strongest scoring zone is the Middle East (TEVA, PTNR, NICE), followed by North America (RY, BMO, BCE). The top regions are MENA, UK/Ireland (ICLR, RYAAY, FCAU, BTI, AMRN, BCS, ITYBY, BSYBF), and North America. Ireland (ICLR, RYAAY, CRH), Bermuda (AXS, GSOL, SIG), Italy (TI, LUX, NTZ, STM), Switzerland (CS, LOGI, UBS, SYT), and Canada are the best countries.
Disclosure: None.


